IDFCFIRSTB trade ideas
IDFC First BankThe Stock has given a beautiful breakout and is about to retest it levels and give a good confirmation to enter in this stock, targets are huge as per my analysis. Targets are 100,124,145 respectively
Only for Educational Purpose
Do your own research

BULLISH REVERSAL in IDFC FIRST BANKA good fundamental stock and obviously at a discounted price. im excepting a good move in banking and fin sectors, seems like a big news positive or negative might come soon. maybe by monday. im bullish on IDFC

IDFCFIRST- 8kafunda 100 G 200IDFCFIRST- 8kafunda 100 G 200
1) consolidation
2) Most likely go Down
3) But in case it jumps, can give good profits, SL given in chart
4) Green line is Sttrong Support Zone.

IDFC FIRST BANK - LONG TERMBUY @ 88.45 RS
TARGET @ 140.85 RS
BUYING CONFIRMATIONS: Rounding bottom breakout in a monthly timeframe
Expected returns are around 59.00 %


idfc first bank bullish wedge / flag pattern. narrow range in daily chart
. bullish wedge / flag pattern
. 2nd time R1 break down

IDFC FIRST bullish wedge .Narrow range in daily chart pattern
.2nd time R1 break out done
. May go to reach previous resistance

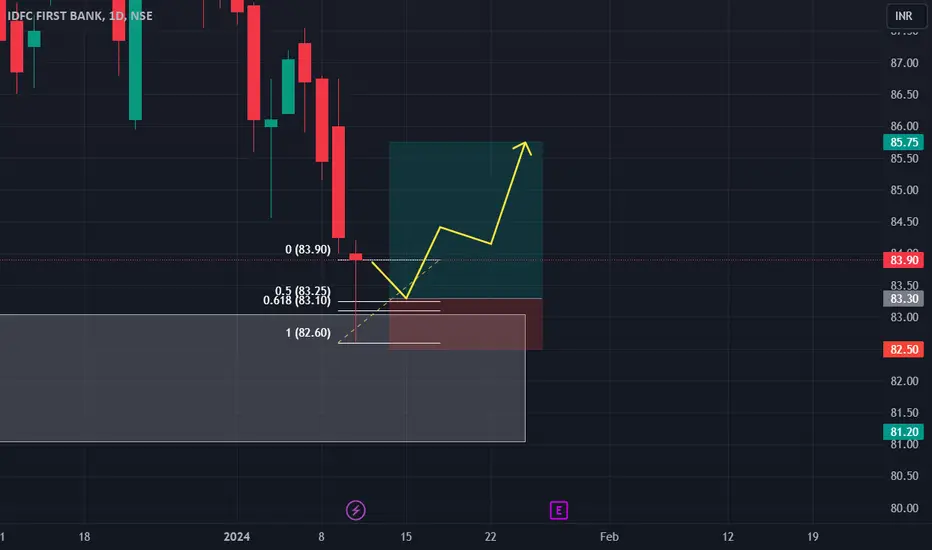
IDFCFIRSTBank at BoS and taken Fibonacci Golden Zone as supportReasons for bullish reasons on #IDFCFIRSTBank
1. Break of Structure
2.Taken Support at Fibonacci Golden Zone
3.Volume increase after a contraction

idfc first bank ltd idfc first bank ltd is a retails ,bank with good % of fiis investment approx. 24%. good growing in retalis banks . we can invest for long term pupose investment .
note : for educational only.
future price expecting more 200+ w+ith t6he respect of current financial status of the company . holding period is more than 1yrs .

IDFCFIRSTBIDFC First bank braking Double bottom Neckline With ample Volume. First Target is 98, In long run we can expect this stock price reach 128.Overall pattern is Cup and Handle. Now Retesting Broken area.

idfc first bank narrow rangeidfc first bank is in narrow range and R1 break out going to reach previous high 92, 95, 97, 100

IDFC First bank- ROUNDING BOTTOMIDFC First Bank- RB breakout and retracement done on monthly.. Trendline support done on monthly. Targets 93, 98 and 140.. Enter atleast after candle close abovce 88.75 on weekly closing basis. The stoploss is candle close below 88.75 after taking entry.
Note: This is for educational purpose only and not buy recommendation.

Taking Support on Resistance Zoneafter breaking w neckline its taking support on same level which it indicates a good chance of upside momentum

idfc first bank IDFC first bank showing good up side targets ,retested its support with confirmations .

IDFC FIRST BANKIn idfc first bank bullish flag pattern near to break out ..lets see if break out or not if not then stock may be go 80 or 75 .. end if break then 92,98 end ma be break all time high also.


#IDFC long trade idea setup (counter trend) 18/11/23Greetings Folks,
today I have prepared a setup of IDFC on NSE
the analysis is as follows-
- the price faced a sudden downfall due to the RBI negative news
- price broke down the trendline support and has swept all the liquidity from the trendline
swept the liquidity in easy language means sucking the power of trendline and now its baseless
- price has made a huge imbalance which needs to be covered quickly for efficient price action
- take profit is mentioned, don't be greedy as we are counter trend trading
don't play with fire, always use a predefined stoploss

IDFCFirst BUY you can buy this stock above 84 and keeps the SL as 80.50, its forming the base, please use the SL based stratergy

#IDFC LONG TRADE SETUPGreetings Folks,
today i have prepared a setup of IDFC on NSE
the analysis is as follows-
- The price made a steep 1 candle huge fall
- quick retracement is highly possible
- i am expecting a gap up tomorrow, above the resistance , have also marked the immediate next resistance
don't play with fire, always use a predefined stoploss

Idfc first bank Butterfly harmonic If 79 price level break then we can see technically 70 level .
79/80 zone is important support.
This analysis based on price action and harmonic.

IDFC first BankIDFC First Bank observed some correction, is it a change of trend ? No i don't see that yet for me it is taking support on trend line and shall change course back to upwards shortly post some rest here.

📈 Exciting Bullish Pattern Alert! 🐂📈 Exciting Bullish Pattern Alert! 🐂
📊 Pattern: Falling channel
📌 Symbol/Asset: IDFCFIRSTB
🔍 Description: Stock is going down in a channel. And its bounce from a support.
👉 Disclosure: We are not SEBI registered analysts, this is not a buy or sell recommendation. Technical patterns are just one piece of the puzzle. Consider conducting further research, consulting with a financial advisor, and managing your risks appropriately.
