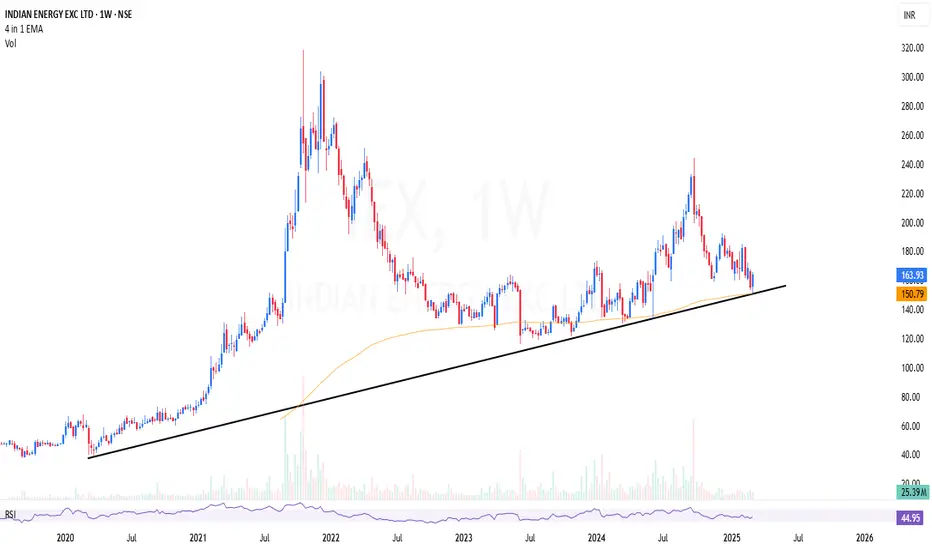
IEX | Looks fully bottomed out and signaling for reversalIEX | Looks fully bottomed out and signaling for reversal
Weekly long time trendline support + 200 EMA support
CMP : 163
IEX trade ideas
Indian energy exchange ltd### **Comprehensive Analysis of Indian Energy Exchange Ltd (NSE: IEX)**
#### **1. Fundamental Analysis:**
**Overview:**
Indian Energy Exchange Ltd (IEX) is India’s largest electricity exchange, offering a platform for the trading of electricity in India. The exchange operates a day-ahead market, intra-day market, and term-ahead market, allowing for the buying and selling of electricity in both short and medium-term periods. IEX plays a crucial role in India’s energy markets by facilitating efficient electricity price discovery and offering renewable energy certificates and energy-saving certificates for sustainability initiatives.
**Key Financials (as of latest available data):**
- **Market Capitalization**: ₹16,900 crore (as of Feb 2025)
- **Revenue Growth**: IEX has consistently shown growth in revenue, driven by increased trading volumes, a larger share of the energy market, and growing demand for renewable energy certificates.
- **Profitability**: The company maintains strong margins and profitability, with a business model that benefits from a dominant position in the electricity trading space.
- **Debt Levels**: IEX has a debt-free balance sheet, which gives it financial stability. The company generates strong free cash flow, allowing it to reinvest in growth and pay dividends to its shareholders.
**Recent Developments:**
- **Government Policies**: The government’s push for electricity market reforms, renewable energy growth, and clean energy initiatives supports IEX's long-term growth prospects. Policies like renewable energy certificates (RECs) are expected to benefit IEX’s business model.
- **Increased Trading Volumes**: The electricity demand in India is rising, and as the market becomes more efficient, IEX is expected to capture a higher share of total traded energy.
- **Diversification into Ancillary Markets**: IEX is working on expanding into new areas like power derivatives and offering products related to energy transition (e.g., carbon credits and RECs).
**Key Strengths:**
- **Dominance in the Market**: IEX is the leader in the electricity trading market, with a dominant share in daily electricity trading volumes.
- **Regulatory Support**: The regulatory framework in India is supportive of exchanges like IEX, with the government encouraging transparency and efficiency in the energy markets.
- **No Debt**: A debt-free balance sheet allows IEX to invest in innovation and other growth initiatives without significant financial stress.
- **Sustainability Focus**: As the push toward renewable energy grows, IEX is poised to benefit from trading renewable energy certificates, which are becoming more integral to India’s energy transition goals.
**Risks:**
- **Market Competition**: Although IEX is the market leader, it faces competition from other electricity exchanges and new players in the renewable energy certificate and carbon credit markets.
- **Regulatory Changes**: Changes in government policies or regulations could impact IEX's operations. The energy sector is heavily regulated, and any unfavorable changes could impact trading volumes or margins.
- **Dependency on Electricity Demand**: IEX’s business is directly tied to the overall demand for electricity in India, and any economic slowdown or disruptions to electricity consumption could hurt the exchange’s revenue.
- **Technological Risks**: As IEX’s operations are technology-driven, any system failures or cyberattacks could affect its operations and investor confidence.
---
#### **2. Technical Analysis:**
**Current Price Action (as of February 2025):**
- **Stock Price**: ₹167 (as of Feb 2025)
- **52-week High/Low**: ₹233 (High) – ₹152 (Low)
- **Recent Trend**: The stock has been in a downtrend since its 52-week high in mid-2024, recently testing support levels near ₹160-170. This range has acted as a strong support zone, and the stock is now consolidating within this range.
**Moving Averages:**
- **50-Day Moving Average (50-DMA)**: ₹173
- **200-Day Moving Average (200-DMA)**: ₹195
- IEX is currently trading below both its 50-DMA and 200-DMA, indicating a bearish trend in the short-to-medium term. The stock would need to cross above the 200-DMA to indicate a trend reversal to the upside.
**Relative Strength Index (RSI):**
- RSI is at **39**, suggesting that the stock is in the oversold territory, which may indicate that the stock is due for a potential bounce. However, an RSI below 30 would suggest a more oversold condition, so the stock could still face further downside before a reversal.
**MACD (Moving Average Convergence Divergence):**
- The MACD line is currently below the signal line, confirming bearish momentum. However, a crossover of the MACD above the signal line could signal an impending bullish reversal.
**Volume Analysis:**
- Volume has been relatively low in recent weeks, indicating a lack of strong directional momentum. A significant increase in volume would be needed to confirm any breakout above resistance levels or a potential breakdown below support.
---
#### **3. Support and Resistance Levels:**
**Support Levels:**
- **₹160-170**: The stock has a strong support zone around ₹160-170. This range has acted as support during recent corrections, and a break below this could trigger further downside toward ₹150.
- **₹145**: A secondary support level lies around ₹145, which is close to the lower end of the stock’s recent price range.
**Resistance Levels:**
- **₹180-190**: The immediate resistance lies around ₹180-190. A breakout above this level could suggest a trend reversal and allow the stock to move toward its 50-DMA.
- **₹200-210**: A more significant resistance zone exists between ₹200-210, which corresponds to the 200-DMA and previous price levels.
**Key Levels to Watch for Short-Term Movement:**
- **Immediate Resistance**: ₹180 (50-DMA)
- **Immediate Support**: ₹160 (recent low)
---
#### **4. Risk and Reward Outlook:**
**Risk Factors:**
- **Regulatory Risks**: Changes in government policies and regulations in the energy market could impact IEX’s growth. Any negative regulatory changes could lead to a reduction in traded volumes.
- **Competition**: Growing competition in the electricity trading market and the entry of new players into the renewable energy market could affect IEX’s market share.
- **Economic Downturns**: In periods of economic slowdown, electricity demand could fall, affecting IEX’s revenue, as trading volumes could decline.
**Reward Potential:**
- **Growth in Trading Volumes**: IEX has strong long-term growth potential as India’s electricity consumption continues to rise. Additionally, the move toward cleaner energy (e.g., renewables and carbon credits) offers new avenues for growth.
- **Market Leadership**: IEX’s leadership in the electricity trading space positions it to benefit from growing demand for energy trading platforms in India.
- **Government Support**: Continued government support for energy reforms, smart grid technologies, and renewable energy growth provides a favorable outlook for IEX.
---
#### **5. Investment Recommendation:**
- **Long-Term Investors**: IEX presents an attractive opportunity for long-term investors, especially as India’s energy market undergoes modernization and the demand for renewable energy grows. The stock’s dominance in the electricity exchange space and its exposure to green energy trading offer solid growth potential. Investors may consider accumulating the stock closer to support levels around ₹160-170, particularly if it shows signs of recovery.
- **Short-Term Traders**: For short-term traders, watching for a breakout above **₹180-190** could present a good entry point. Alternatively, a breakdown below **₹160** could trigger further downside, and traders might consider exiting or shorting the stock in such a scenario.
---
### **Disclaimer:**
The information and analysis provided here are for educational and informational purposes only. We are not registered with SEBI (Securities and Exchange Board of India) or any other regulatory body, and this should not be construed as investment advice. Stock market investments are subject to market risks, and past performance is not indicative of future results. Before making any investment decisions, it is important to conduct thorough research, seek advice from a certified financial advisor, and understand your risk tolerance. The views expressed are based on publicly available data and personal analysis and may not necessarily reflect the views of other professionals or organizations.

IEX Bullish Base Formed NSE:IEX today gave a good up move, confirming the recent base as a strong bullish base, recently it posted its monthly volumes in Jan up 16% YoY.
About:
NSE:IEX provides an automated platform and infrastructure for trading electricity units for the physical delivery of electricity.
F&O Activity:
Long Buildup in Futures with 180 PE Gaining Significant OI.
Trade Setup:
Looks like a good 1:1 trade setup with the recent base as a strong support zone, RSI and MACD trending upwards.
Target(Take Profit):
Around 206 Levels for Swing & Positional Trader.
Stop Loss:
Entry Candle Low for Swing Trader and Recent Base for Positional Trader.
📌Thank you for exploring my idea! I hope you found it valuable.
🙏FLLOW for more
👍BOOST if useful
✍️COMMENT Below your views.
Meanwhile, check out my other stock ideas below until this trade is activated. I would love your feedback.
Disclaimer: "I am not SEBI REGISTERED RESEARCH ANALYST AND INVESTMENT ADVISER."
This analysis is intended solely for informational and educational purposes only and should not be interpreted as financial advice. It is advisable to consult a qualified financial advisor or conduct thorough research before making investment decisions.

IEX continuing downtrendIEX has posted before Daily Timeframe view, now detailed technical view in 1Hr, price has started down move in minutte wave3 of minor Wave C which will last for a year.

2 Stocks Price action for 30 Jan 2025 I daily make educational content videos for swing / positional trading

IEX Head & Shoulder patternFound Head & Shoulder pattern in daily time frame. Target and stoploss mentioned.

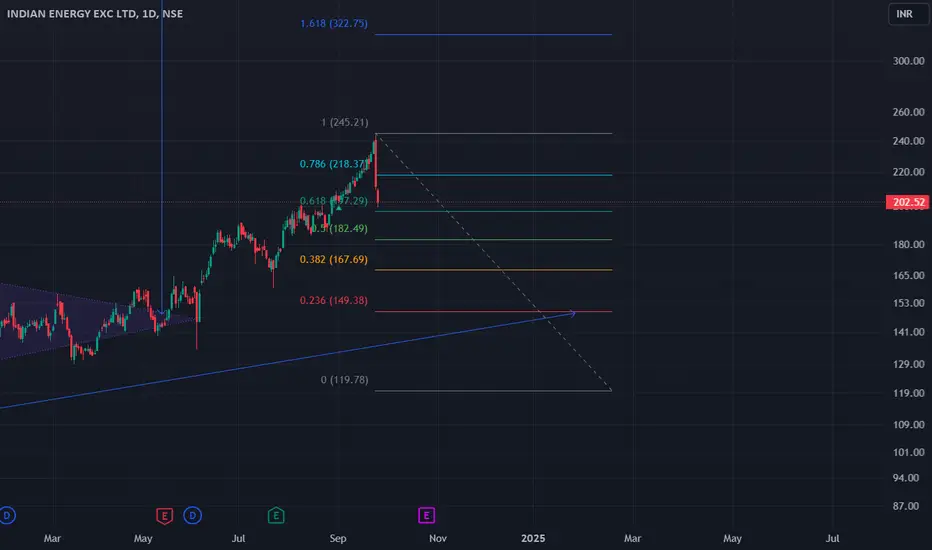
ABC Correction1]Second wave retracing to the 0.68% Fibonacci level. In Elliot Wave Theory, the second wave is typically a corrective wave that retraces a significant portion of the first impulse wave. The 0.618 (61.8%) level is particularly significant, indicating a strong potential support or resistance zone & suggesting it’s near completion.
2]Completed ABC Correction: This is a common Elliott Wave pattern, representing a three-wave corrective structure labeled as ABC. It implies that the correction has potentially concluded, paving the way for the next impulse wave.
3]Mother Candle/Inside Bar is formation:
Breakout from the range defined by the mother candle as an entry point.

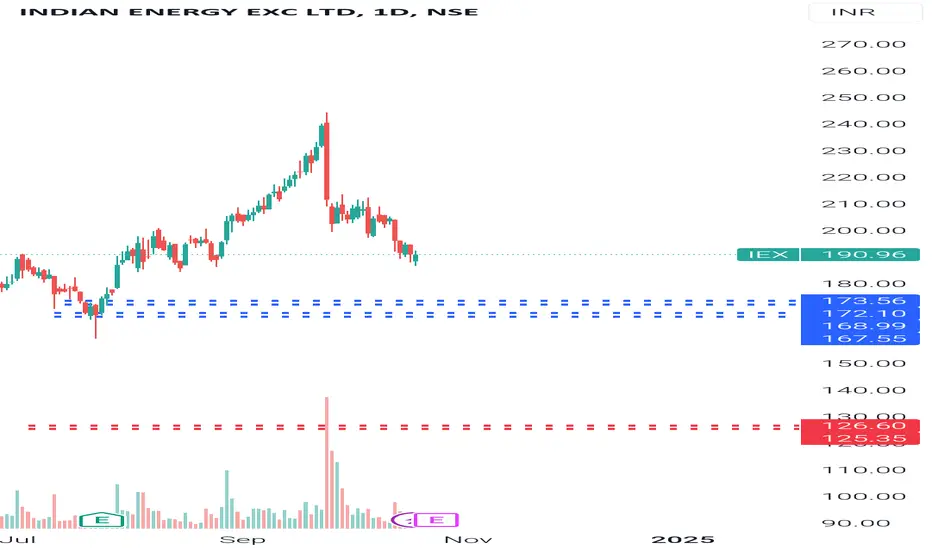
IEX - Is it done correcting? IEX has filled the Fair value gap of 168-171 level and price is rejected from this fair value gap.
There is a gap at 163-165 level that needs to be filled for it to move up efficiently. 163-165 level provides a great risk reward set up.
Have to wait and see if we will fill this gap and then move up.

IEX for long term looking goodStock IEX looking good on the chart, it is making kind of cup and handle pattern. This is just my view.
I am looking for 244 levels in long term holding.
This is just my view, please do your analysis before any trade.

IEX - Weekly AnalysisIn the Weekly Chart of IEX ,
we can see that, it showed a strong rejection at resistance of 240-242.
Also, it has now shown a strong up move a support zone.
Let it create a Halt candle and then we can enter with a SL and Targets.
Expected momentum is shown in chart.


Indian energy exchange in weekly analysisIndian energy exchange in weekly analysis
It touches the previous support RSI is below 40 and MACD is also crossover signal line as per technical analysis
company also give good quarterly result is expected to give quarterly result as well as in future
do your study and then invest

IEX Analysis .. wealth creator stock?IEX look god for long term holding, as I have mention in my last idea for IEX. looks like again time to consider for investment
Will be will entry point if it comes down around 165 to 173 with risk (SL) 125 same a earlier or as per your comfort.
Potential to go 3000+ in coming years !!
Please do your due diligence before trading or investment.
**Disclaimer -
I am not a SEBI registered analyst or advisor. I does not represent or endorse the accuracy or reliability of any information, conversation, or content. Stock trading is inherently risky and the users agree to assume complete and full responsibility for the outcomes of all trading decisions that they make, including but not limited to loss of capital. None of these communications should be construed as an offer to buy or sell securities, nor advice to do so. The users understands and acknowledges that there is a very high risk involved in trading securities. By using this information, the user agrees that use of this information is entirely at their own risk.
Thank you.
IEX - Long TermOn monthly chart stock forming Cup Pattern. Expected to reach 240 levels. Around 240 levels it should consolidate and start it upwards journey post 2-3 months of consolidation. Volume has increased with prices in past 6 months. Hold for long term. Stocks might move slow but should be resilient.

News related Breakdown (Negative): Indian Energy Exchange (IEX)IEX has been in a bullish trend since Jun 2024 after taking strong support from 145 levels.
It reached one year high of 263.
Market news on IEX:
IEX cracked over 10% today due to a report that FY25 may implement Market coupling. News reports suggested the Centre will implement market coupling for power exchanges.
Market Coupling will mean these exchanges will trade electricity at one price at any point of time.
If implemented, power exchanges will function as a platform where only buy and sell bids are accepted and power is delivered to the buyer.
Support levels: 200, 187, 167
Resistance levels: 242.
THE IMPLICATION OF MARKET COUPLING HAS TO BE SEEN IN LONG TERM AS THERE ARE SEVERAL CONSTRAINTS IN IMPLEMENTING AT THE PAN INDIA LEVEL.

Perfect time and price to enterStill sticking to my analysis keeping target of 400 though after a fall of IEX more than 20%. I still don't consider a stop loss trigerred but considering a entry level one more time, get ready for a big leap.
IEX Long strategyBuy between the blue lines 160rs to 190rs once the stock gives breakout about 215rs we can expect simultaneous target to be acheived
disclaimer- this is not any investment call or idea , this just my view and it can go wrong ,this is only for educational purposes trade at your own risk

IEX 70% UPSIDEIEX is a buy for the 70% Gain
Indian Energy Exchange is down around 10% today
on the long term its poised to deliver a solid return of 70%.
still below its All time high .
After today's downfall the stocks looks prominent on the charts for buying.
With the rising demand and consumption IEX will deliver strong growth.
Everything is set in favour of the stock.
Note : Having Quantities of the stock at various price levels, Adding more on the dips.

IEX 10% CORRECTED TODAYIEX corrected it high value we can try to add in our portfolio. this type of corrections give good return

IEX SUPPORT RESISTANCE LEVELFor Indian Energy Exchange (IEX), here are the key support and resistance levels:
Support Levels: ₹131, ₹1381
Resistance Levels: ₹140, ₹145.81
These levels can help you plan your trading strategy.
Psychological Support: These levels are based on
psychological values, such as round numbers (e.g.,
100, 200, 300) or important milestones.
Trend Line Support: These levels are formed by
connecting two or more points on a chart to create
a line that represents the trend.

IEX breakoutstock looks fantastic on weekly and daily charts.
can move towards all time high, resistance was 200-210 which has been broken and would be now important support levels.
Made Rounding Bottom and that too on long term charts, which is confirming perfectly eligible buy stock.
watch out levels 235-45, once it overcome these levels we can see stock moving like a rocket.
RSI nearly 75 can pull off for sometime, but can watchout fot it.
Dis- not a recommendation, just for knowledge. consult your advisor before investing.

IEX breakout after consolidation IEX stock stock shows a breakout following a long period of consolidation.
