Can expect a good move after breakoutIex is consolidating after breakout, can expect a good move after the breakout.
INDIAN ENERGY EXCHANGE LIMITED
135.30INRD
−0.70−0.51%
At close at 10:49 GMT
INR
No trades
IEX trade ideas


SELF EXPLANATORY SERIES : QUICK ANALYSIS ON IEXIn this self explanatory series I will be posting charts with pure technical analysis only without full length explanations , Traders can ask their doubts in comments section, Happy trading.
Disclaimer : This idea was to just give you an insight about my own view and personal observations. Please do your own research or consult an investment advisor before doing any investment or trading.


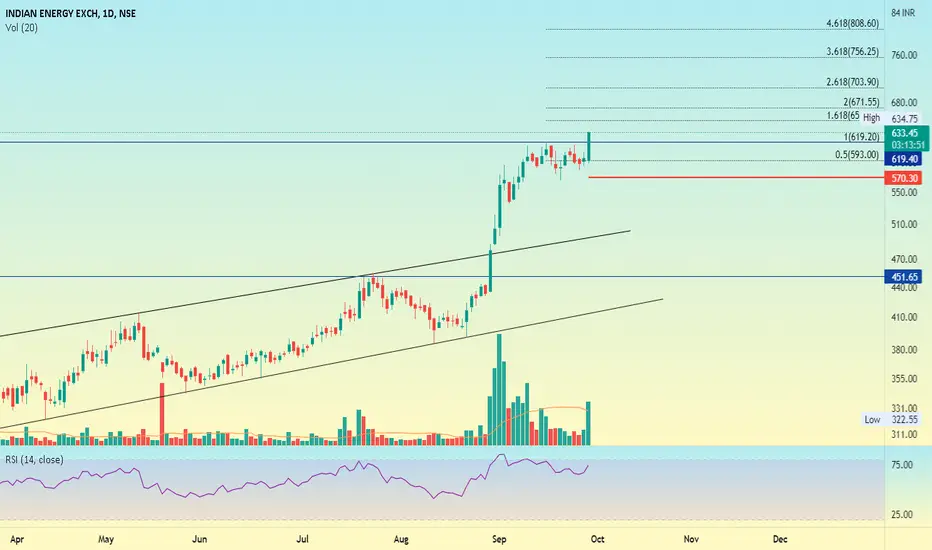
IEX - Update on last idea (15.09.2021)In the previous post shared for IEX stock, I have done Fibonacci retracement analysis over the bull run of IEX to get an idea for further supports and resistance levels. The stock has managed to sustain the peak of the previous rally at 582-583 levels & has been consolidating in the range from 582 to 614. There is also an ascending trend line where the stock is taking support at. Also, we have 2 AVWAPs converging which also suggests that we may see a move in either direction with momentum. My biasedness is on the long side with a strict SL of 540 on a closing basis (as mentioned in the previous post.

IEX looks good for swingIEX (Indian Energy Exchange)
- Swing High Breakout - ✔
- Good Breakout Volumes - ✔
- Huge Accumulation & Price activity a few days before - ✔
- Spread Chart Breakout - ✔
- RS+ & Strong Relative Strength - ✔
Other points to note:
The new Electricity (Amendment) Bill 2021 delicenses State Monopoly on Electricity. Which is now open to competition from all private Electricity Distribution Companies. Consumers can now choose their Discom (like telcos)
Along with the boost in Electricity Distributor's business, it will also boost revenues for IEX.
Looks good for swing & Positionally


Add IEX to your watchlistThis scrip is in an uptrend for a while and it had recently given a breakout from a mojr resistance, it is now consolidating a bit. It had formed a small wedge sort of pattern in which it's being traded for past one month. By the way there's also a small trendline within the wedge pattern, so this scrip ha the potential to go up in coming days, if the markers too support it. By going with the Fib Pivot, this scrip has the potential to go to 640 in coming weeks but the BB shrinking, so the consolidation may continue for some more days.


IEX intraday trade idea for 15th Sep#IEX has seen strong upside momentum so far. Will this turn now, though it seems to be at support now? entry and exit levels on the chart (refer black/blue lines). Place SL@0.6% of the entry price. Zones (if present are in pink/orange) are the places where it's unsafe to enter. #INTRADAY


