IFCI Price Action## Trend Overview
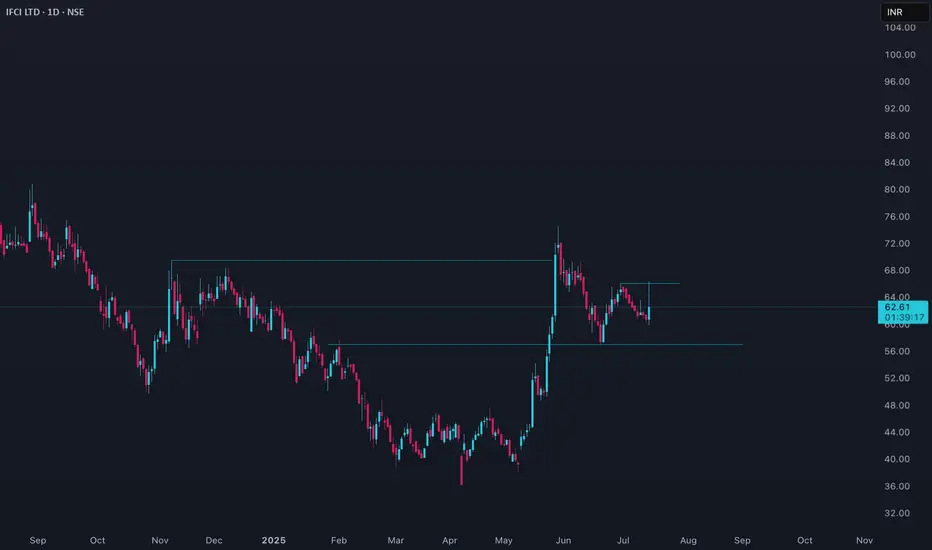
IFCI has shown significant volatility in recent months. After a strong rally earlier in the year, the stock has entered a corrective phase, with the price currently hovering around ₹60.58–₹64.50 as of July 14, 2025. The broader trend over the past year has been negative, but the last quarter displayed a sharp upward move, followed by some consolidation and profit booking.
## Price Action & Momentum
- **Short-Term:** The stock is consolidating after a steep rise in the last three months, where it gained nearly 49%. The recent pullback reflects profit-taking and market caution.
- **Medium-Term:** Despite the recent correction, the price remains above major moving averages, indicating that the medium-term uptrend is still intact.
- **Long-Term:** IFCI is down about 12% over the past year, but up over 534% in three years, highlighting its high volatility and cyclical nature.
## Technical Indicators
- **Moving Averages:** The daily price is above its 50-day and 200-day moving averages, supporting a positive medium-term outlook. Shorter-term averages are converging, suggesting a pause or consolidation.
- **Relative Strength Index (RSI):** The RSI is in the overbought zone, indicating potential for further cooling or sideways movement before the next trend emerges.
- **MACD:** The MACD indicator is positive, but momentum has slowed, suggesting the rally may be losing steam.
- **Volatility:** The stock displays high volatility, with a beta above 2, indicating larger swings compared to the broader market.
## Support and Resistance
- **Immediate Support:** Around ₹60, where recent buying interest has emerged.
- **Major Support:** Near ₹55, which aligns with the 50-day moving average and a previous breakout zone.
- **Immediate Resistance:** Near ₹65, which coincides with recent swing highs.
- **Major Resistance:** The 52-week high at ₹91.40.
## Volume and Sentiment
- Recent sessions have seen increased volume on down days, reflecting profit booking and cautious sentiment.
- Long-term sentiment remains speculative, with traders reacting quickly to momentum shifts and news.
## Summary
IFCI remains a high-beta, volatile stock with a history of sharp rallies and deep corrections. The current daily chart shows consolidation after a strong uptrend, with the price holding above key supports. As long as the stock remains above its 50-day moving average, the medium-term bullish structure is intact. However, the overbought technical indicators and recent profit-taking suggest that short-term movements may remain range-bound or slightly negative until a clear breakout or breakdown occurs. Risk management is crucial given the elevated volatility.
IFCI trade ideas
RESEARCH REPORT: IFCI Ltd.Executive Summary
IFCI Ltd. recently staged a high-volume breakout on the weekly chart, triggering interest from technical traders. However, the core business remains fundamentally weak, with operating losses persisting. The balance sheet shows improvement, hinting at a slow turnaround, but lacks revenue momentum.
Price (Close): ₹62.50 (as of July 5, 2025)
Breakout Volume: 673 million (Highest in 2+ years)
Target (Technical): ₹85–₹90
Stop-loss: ₹58
Fundamental EPS: Negative (FY25 net loss ₹1,761 Cr) ***
Valuation: Not meaningful due to persistent losses
Technical Analysis
✅ Bullish Setup on Weekly Chart
Breakout Level: ₹50 (previous resistance)
High after Breakout: ₹67.40
Current Price: ₹62.50
RSI: 58.26 – still in bullish zone
Volume Surge: 673 million (extremely strong accumulation)
Entry Strategy:
Buy on Breakout-Pullback above ₹67.40 **
Initial Stop-loss: ₹58
Target: ₹85–₹90
Ownership & Institutional View
Category % Holding (as of Mar 2025)
Government of India ~72.5%
LIC + FII Combined ~5%
Retail ~22.5%
Recommendation:
Traders may ride momentum above ₹67. Investors should wait for profitability triggers.
Disclaimer
This report is prepared for informational purposes only by Bay-Street Trader Investment Research. Opinions are based on data available as of July 2025. Readers are advised to exercise due diligence and consult a certified financial advisor before making any investment decisions.
Takeaway: Majority-owned by GoI; often treated as a strategic turnaround play.

Good momentum stock, gave clean rally, pulled back and consolidaGood momentum stock, gave clean rally, pulled back and consolidated forming narrow ranges ready for B.O ( The output of the BO is based on mkt condition)

IFCI: Explosive Move Hits a Key WallTechnical Setup – IFCI Ltd. on the weekly timeframe chart
Current Price: ₹70.31
Breakout Confirmation: Price broke above major trendline resistance (dotted line) with strong volume
Volume Profile: Highest traded zone was around ₹42–₹50 (base built here)
Fibonacci Levels: 61.8% broken = bullish signal
Targets: 🎯 ₹91.56 (100% Fib level) 🎯 ₹161.79 (161.8% extended Fib target – long term)
📊 Fundamental Story – Government owned NBFC
Focused on infrastructure and industrial finance
Recent market rally shows renewed investor interest
Benefits from:
• PSU sector momentum
• Government capex push
• Improved asset quality & restructuring progress
Turnaround story in the making, driven by fundamentals + reform
Like, comment your thoughts, and share this post!
Explore more stock ideas on the right hand side your feedback means a lot to me!
Disclaimer: This post is for educational purposes only and should not be considered a buy/sell recommendation.

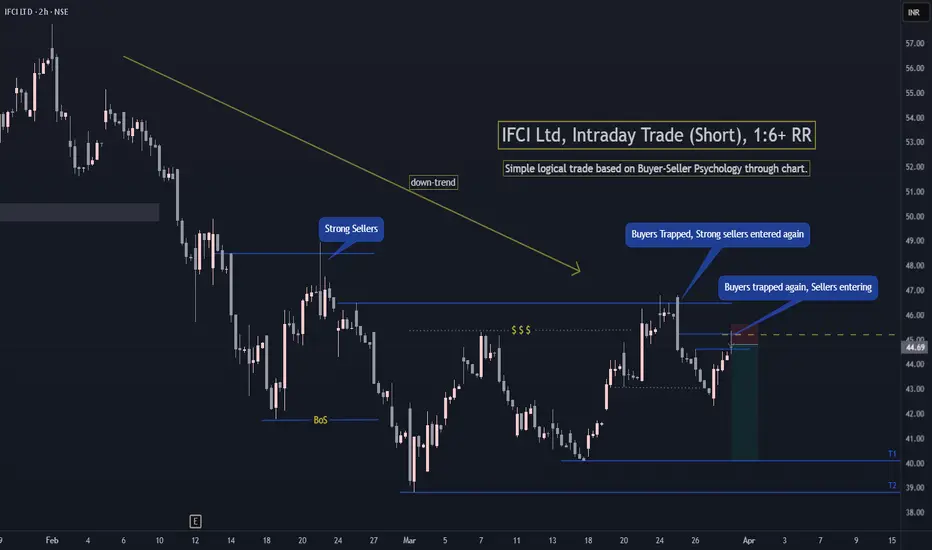
IFCI Intraday Trade (Short)IFCI is in down-trend and sellers have again trapped the buyers in discount zone. So there are high chances of price moving to Target 1 if Nifty is not very much bullish in coming sessions.
Simple trade based on buyer-seller psychology understanding. 1:6+ RR Trade.
If you have any questions. Do ask in comments.
Follow for more such simple and awesome setups. Thanks. Happy trading!
IFCIINVERTED HEAD & SHOULDER PATTERN FORMATION
Neckline breakout point is @ 68.40 (roundoff 69)
Pattern target is @ 75.45
Disclaimer : This is my view & is my idea. And also it is only for educational purpose. Before buy / exit kindly contact your financial advisor


IFCI - Multiyear Breakout - MonthlyIFCI - Multiyear Breakout - Monthly
Multi-Year Breakout: The chart indicates a multi-year breakout with strong volume, suggesting a potential long-term uptrend.
16yrs high Breakout: Neckline marking a 16yrs breakout, which could be a shorter-term confirmation of the trend.
Support Level: The low of the breakout candle is marked as a support level at 59, which can be a critical point to watch for potential pullbacks.
This setup looks promising for those interested in technical analysis and long-term investments.
IFCI, previously known as Industrial Finance Corporation of India, is an Indian Government owned non banking finance company established to cater to the long-term finance needs of the industrial sector.
IFCI Ltd. recently announced its Q1 results for the period ending June 30, 2024. Here are the key highlights:
Revenue: The company reported a revenue of ₹4,051.2 million, up from ₹3,243.6 million in the same quarter last year.
Net Loss: The net loss decreased to ₹1,082 million from ₹1,399.8 million year-over-year (YoY), marking a 24.64% improvement.
Earnings Per Share (EPS): The EPS for Q1 stands at ₹-0.44, a decrease of 4.34% YoY2.
Operating Income: Despite a 90.05% quarter-over-quarter (QoQ) decline, the operating income increased by 106.82% YoY.
SG&A Expenses: Selling, General & Administrative expenses saw a reduction of 29.44% QoQ and 8.04% YoY.
These results indicate that while IFCI has made significant annual progress, it faced challenges in the most recent quarter. The reduction in SG&A expenses suggests improved operational efficiency, but the decline in EPS highlights ongoing profitability challenges

IFCI buy this PSU gemYou can do you own analyzes and buy this stock, it is forming cup and handle pattern, i think it will go up soon once it forms complete handle. Good targets can be seen.

IFCI BO Ready LongDate : 28-07-2024
-------------------------------------
BO + ATH RESEARCH TO OBSERVE
IFCI Looks Good ABOVE 85
SL 45
Target 115, 145, 175, 266
Hold few Weeks to Months
Please consult your financial advisor before investing
All research for educational purposes only.


IFCI bullish; above 72 ? - Monday 15-July.The above information does not constitute investment/trading recommendation and it is purely for educational purpose....
INTRADAY Trading Strategy in 3 stages of breakouts:
1) Impulse upmove stage: The strong upmove (nearly upto 1.5% from trigger-price) happens within five minutes. "High Risk Traders" buy on breakouts in hope of continuation of upmove. "High Risk Traders" may have to patiently wait through the Pullback-Consolidation stage to realize profits. High risk:High reward set up as breakouts may fakeout (reversal)also
2) Pullback-Consolidation stage: After the above "Impulse upmove stage"; the price may then pull back and move sideways (between "Open" price and "High" of the above "Impulse upmove stage"). "Safe traders" with minimum risk profile wait for a breakout from the consolidation stage to enter into trade , to book high profits in the final "Breakout continuation" stage
3) Breakout continuation: Stocks often in the third stage breaks up above the "High" of the first "Impulse upmove stage" and continue to go higher again.(another 2-3%)
Both Safe Traders/High Risk Traders book profits at this stage
SWING Trading Strategy:
Position is kept open, only upon stock closing above the entry price on day closing basis and is held on for 5-10 trading sessions for larger gains (5-10%)
The above information do not constitute, financial, investment, trading, or other types of advice or recommendation.It is purely for educational purpose....

IFCI GOING TO HIT LIFE TIME HIGH!IFCI break out at 65 in the weekly time frame. If he hold these level then in coming week it will be hit life time high at level 80.
My target for IFCI
Long term : 120
Short term: 80
If you are long term investor, it will be good opportunity to buy at this level.

IFCI -Trend Breakout and coming for retestingIFCI -Trend Breakout and coming for retesting
Disclaimer:-
This is only for educational purposes. The author is neither a registered stockbroker nor a registered advisor and does not give investment advice. His comments are an expression of opinion only and should not be construed in any manner whatsoever as recommendations to buy or sell a stock, option, future, bond, commodity, index, or any other financial instrument at any time.

IFCI -ROUND BOTTOM PATTERN. NEXT POSSIBLE TARGET 100IFCI has completed a Round Bottom Pattern and is facing resistance @ 70-73. Once the level has been broken decisively we can look to enter afresh for the next target of 100.

Cup and Handle PatternGood volume buildup in daily and weekly time frame.
Cup and handle pattern formation on weekly time frame.
Fundamental's are OK.
FII has increased its stake.
NOTE: I do my analysis, do yours before trade.

IFCI - PSU Stock - VCP Pattern - Best to add above 70 IFCI - PSU Stock. VCP Formation
Best to add above 70 with strict stoploss of 61.
Usually the stock doesn't perform after budget, so watch out this hypothesis.
Always buy when the stock is in uptrend and average up.
Disclaimer : Educational content. Please do your own research.

IFCI READY FOR COMEBACK , NEXT MULTIBAGGERThe stock is a perfect example of rounding bottom pattern moreover it has been improving its fundamentals drastically at an unprecedented rate which is a pretty good sign , the company has posted a profitable years after 5 long tiresome years , also the volumes have gained similar like 2007 levels
Technically the company has completed its 2 stages which are donwtrent (2007-2010) and consolidation (2011-2023) and now its time for the bull to take over (2024-20??) .
TARGET 1 -77
TARGET 2 -115.75
TARGET 3 -226.25
TECHNICALS + FUNDAMENTALS + VOLUMES + SECTOR MOMENTUM ARE ALL ALIGNED

IFCI Stock Analysis: IFCI LTD
Date: June 26, 2024
Observation:
IFCI LTD is showing a strong resistance around the 67-68 INR level, as indicated by the black horizontal trendline.
The stock has made multiple attempts to break through this resistance level but has failed so far.
Recent price action indicates a potential breakout above this resistance.
Technical Indicators:
Price Action: The stock closed at 62.85 INR, showing a positive movement of +1.39% for the day.
Volume: Increasing volume indicates buying interest as the price approaches resistance.
Moving Average: The blue line represents the 50-day moving average, providing support and confirming the upward trend.
Potential Scenarios:
Bullish Breakout: If the stock breaks above the resistance level with strong volume, it could indicate a bullish trend continuation.
Rejection at Resistance: If the stock fails to break through the resistance, it may pull back to support levels around 56-58 INR.
Trading Plan:
Entry: Consider entering a long position above 68 INR with confirmation of increased volume.
Stop-Loss: Set a stop-loss below the recent low at 60 INR to manage risk.
Target: Initial target can be set at 75 INR, with further upside potential if the breakout is strong.
Hashtags:
#StockMarket #TradingView #TechnicalAnalysis #IFCI #SwingTrading #BreakoutTrading


IFCI - Cup & Handle patternAll details are given on chart. If you like the analyses please do share it with your friends, like and follow me for more such interesting charts.
Disc - Am not a SEBI registered analyst. Please do your own analyses before taking position. Details provided on chart is only for educational purposes and not a trading recommendation

Ifci high long term targetin.tradingview.com
Its not a recommendation but my own study , chart is self exclamatory.

IFCIGood Company, Good Fundamental.
Support Zone: 40.50 to 43.75
Maybe touch: 80/105/135
My Analysis.
Please seek advice from your advisor.
