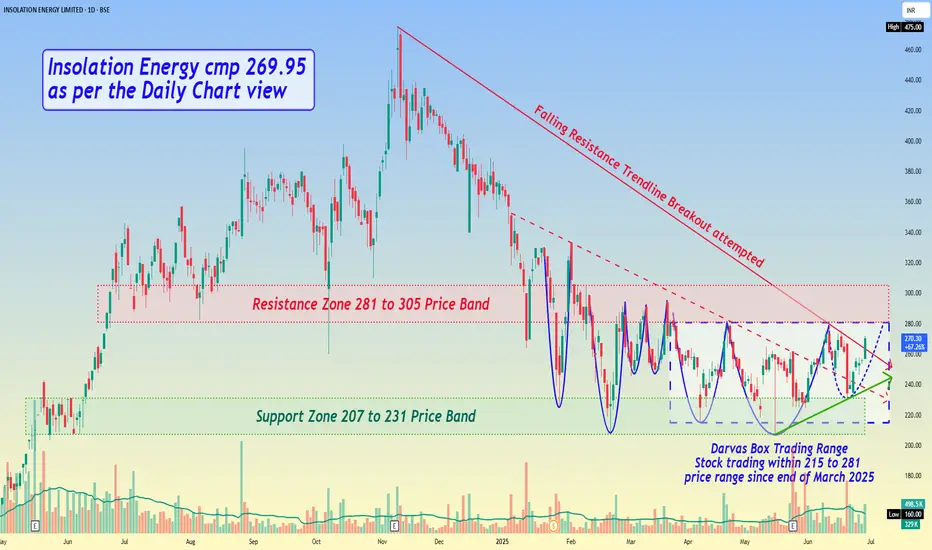
Insolation Energy cmp 269.95 as per the Daily Chart view*Insolation Energy cmp 269.95 as per the Daily Chart view*
- Support Zone 207 to 231 Price Band
- Resistance Zone 281 to 305 Price Band
- 1st Falling Resistance Trendline Breakout done
- 2nd Falling Resistance Trendline Breakout is been attempted
- Technical indicators of EMA, BB, MACD, RSI are se
Insolation Energy Ltd.
No trades
6.65 INR
1.26 B INR
13.34 B INR
65.99 M
About Insolation Energy Ltd.
Sector
Industry
Website
Headquarters
Jaipur
Founded
2015
IPO date
Oct 10, 2022
Identifiers
2
ISIN INE0LGX01024
Insolation Energy Ltd. engages in manufacturing solar photovoltaic panels. It focuses on solar module, solar PCU, and solar battery. The company was founded by Manish Gupta and Vikas Jain on October 15, 2015 and is headquartered in Jaipur, India.
Related stocks
Insolation Energy LtdBSE:INA Insolation Energy Ltd
Company manf. Polycrystalline Monocrystalline modules. Its major domestic customers include Livguard Energy, Livfast Batteries, Shakti Pumps India, Microtek International, Sunroof Tech.
Right Now Risk Reward is not in Favour
Wait for Correction or Consolidation

INSOLATION ENERGY LIMITEDINTRODUCTION
Insolation Energy belongs to the Industry of Electric Equipment - General. Company’s Total Operating Revenue is Rs. 258.67 Cr. and Equity Capital is Rs. 20.83 Cr. for the Year ended 31/03/2023.
Market Capitalization sales Shares in Float
INR 7,806.

Insolation Energy Limited Business segments
i. Solar PV module manufacturing: 96.3% of FY22 revenue
ii. Solar Power Conditioning Unit (PCU) and Lead Acid Batteries trading: 3.27% of FY22 revenue

Breakout abv 435-It is engaged in the business of manufacturing solar panels and modules of high efficiency of various sizes.
-Product portfolio
(i) Polycrystalline modules
(ii) Monocrystalline passivated emitter and rear cell (Mono PERC) modules. Its solar PV modules (including those under testing) have wattages


See all ideas
Summarizing what the indicators are suggesting.
Oscillators
Neutral
SellBuy
Strong sellStrong buy
Strong sellSellNeutralBuyStrong buy
Oscillators
Neutral
SellBuy
Strong sellStrong buy
Strong sellSellNeutralBuyStrong buy
Summary
Neutral
SellBuy
Strong sellStrong buy
Strong sellSellNeutralBuyStrong buy
Summary
Neutral
SellBuy
Strong sellStrong buy
Strong sellSellNeutralBuyStrong buy
Summary
Neutral
SellBuy
Strong sellStrong buy
Strong sellSellNeutralBuyStrong buy
Moving Averages
Neutral
SellBuy
Strong sellStrong buy
Strong sellSellNeutralBuyStrong buy
Moving Averages
Neutral
SellBuy
Strong sellStrong buy
Strong sellSellNeutralBuyStrong buy
Displays a symbol's price movements over previous years to identify recurring trends.
Frequently Asked Questions
The current price of INA is 112.60 INR — it has increased by 9.85% in the past 24 hours. Watch Insolation Energy Ltd. stock price performance more closely on the chart.
Depending on the exchange, the stock ticker may vary. For instance, on BSE exchange Insolation Energy Ltd. stocks are traded under the ticker INA.
INA stock has risen by 13.34% compared to the previous week, the month change is a −17.57% fall, over the last year Insolation Energy Ltd. has showed a −61.28% decrease.
INA stock is 17.47% volatile and has beta coefficient of 2.03. Track Insolation Energy Ltd. stock price on the chart and check out the list of the most volatile stocks — is Insolation Energy Ltd. there?
Today Insolation Energy Ltd. has the market capitalization of 22.59 B, it has decreased by −2.53% over the last week.
Yes, you can track Insolation Energy Ltd. financials in yearly and quarterly reports right on TradingView.
INA net income for the last half-year is 800.71 M INR, while the previous report showed 649.25 M INR of net income which accounts for 23.33% change. Track more Insolation Energy Ltd. financial stats to get the full picture.
Yes, INA dividends are paid annually. The last dividend per share was 0.10 INR. As of today, Dividend Yield (TTM)% is 0.10%. Tracking Insolation Energy Ltd. dividends might help you take more informed decisions.
Insolation Energy Ltd. dividend yield was 0.04% in 2024, and payout ratio reached 1.68%. The year before the numbers were 0.00% and 0.00% correspondingly. See high-dividend stocks and find more opportunities for your portfolio.
As of Feb 7, 2026, the company has 421 employees. See our rating of the largest employees — is Insolation Energy Ltd. on this list?
EBITDA measures a company's operating performance, its growth signifies an improvement in the efficiency of a company. Insolation Energy Ltd. EBITDA is 1.82 B INR, and current EBITDA margin is 12.17%. See more stats in Insolation Energy Ltd. financial statements.
Like other stocks, INA shares are traded on stock exchanges, e.g. Nasdaq, Nyse, Euronext, and the easiest way to buy them is through an online stock broker. To do this, you need to open an account and follow a broker's procedures, then start trading. You can trade Insolation Energy Ltd. stock right from TradingView charts — choose your broker and connect to your account.
Investing in stocks requires a comprehensive research: you should carefully study all the available data, e.g. company's financials, related news, and its technical analysis. So Insolation Energy Ltd. technincal analysis shows the neutral today, and its 1 week rating is sell. Since market conditions are prone to changes, it's worth looking a bit further into the future — according to the 1 month rating Insolation Energy Ltd. stock shows the sell signal. See more of Insolation Energy Ltd. technicals for a more comprehensive analysis.
If you're still not sure, try looking for inspiration in our curated watchlists.
If you're still not sure, try looking for inspiration in our curated watchlists.