India Cement setupWeekly time frame setup entry when weekly close above 9ema and 9 ema below 50 sma and both above 200 ema
(9 EMA below 50 EMA) both above 200 EMA
risk:reward= 1:4
stoploss below 200 ema close weekly candle or weekly candle close below swing low.
India Cements latest financial update and key featu
Next report date
—
Report period
—
EPS estimate
—
Revenue estimate
—
0.40 INR
−1.44 B INR
41.49 B INR
73.36 M
About India Cements Ltd.
Sector
Industry
CEO
Suresh Vasant Patil
Website
Headquarters
Chennai
Founded
1946
ISIN
INE383A01012
FIGI
BBG000CSZP55
India Cements Ltd. is a holding company, which engages in the manufacture and sale of cement and clinker. It operates through the following brands: Sankar Super Power, Coromandel King, and Raasi Gold. The company was founded by S. N. N. Sankaralinga Iyer and T.S. Narayanaswami on February 21, 1946 and is headquartered in Chennai, India.
Related stocks

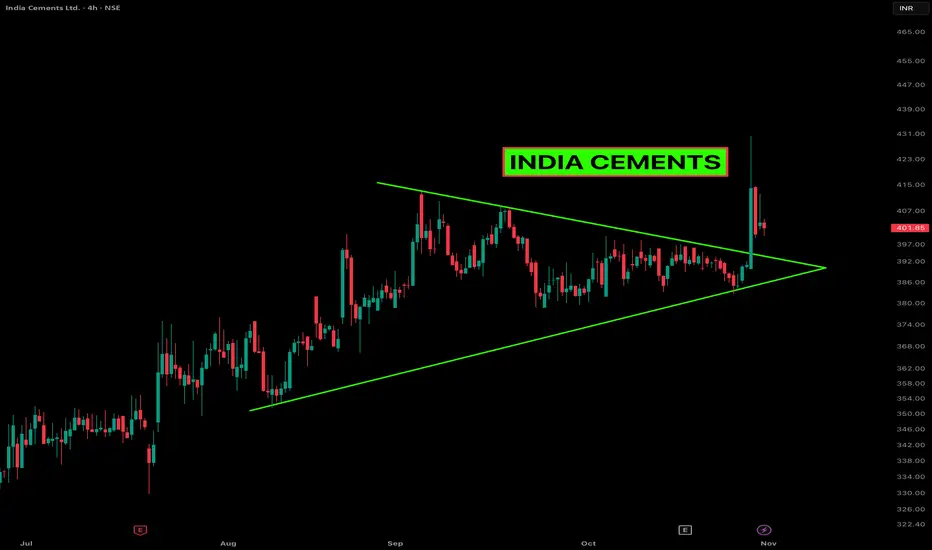
INDIA CEMENTS – Powerful Breakout from a Symmetrical TriangleAfter months of coiling price action, India Cements finally broke out of a clean symmetrical triangle on the 4-hour chart. The breakout came with a solid volume expansion, showing that bulls have been waiting for this move. Price surged quickly past the resistance line, followed by a short pullback
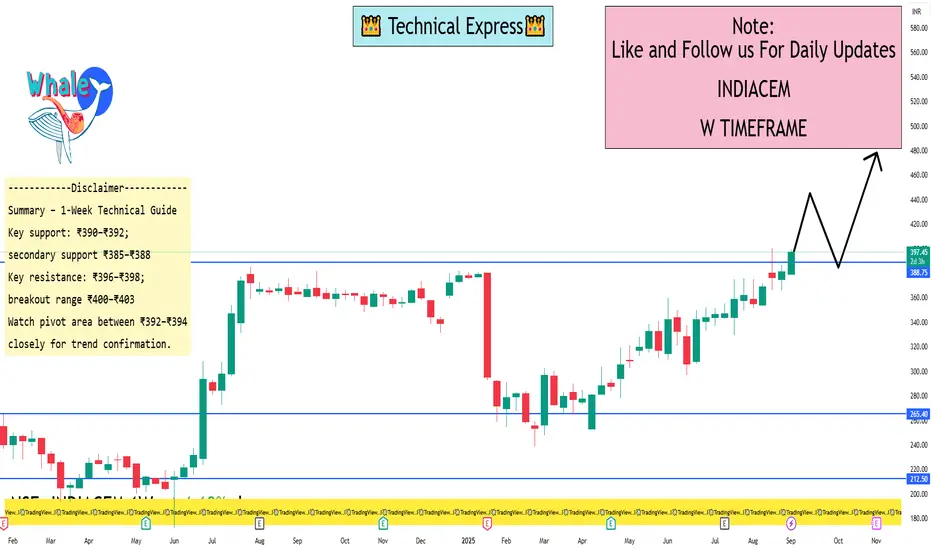
India Cements Ltd. 1 Week ViewCurrent Trend & Technical Overview
On daily analysis, the stock is in a Strong Buy zone, with all moving averages across 5-, 10-, 20-, 50-, 100-, and 200-day periods signaling buy, alongside predominantly bullish indicators such as RSI (~74.9), MACD, ADX, ROC, and more
The stock is trading near it
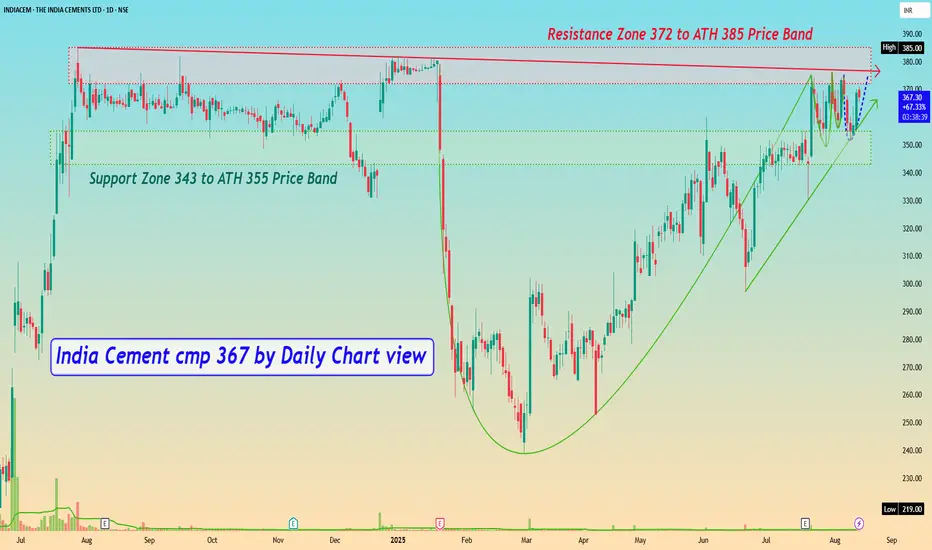
India Cement cmp 367 by Daily Chart viewIndia Cement cmp 367 by Daily Chart view
- Support Zone 343 to ATH 355 Price Band
- Resistance Zone 372 to ATH 385 Price Band
- Falling Resistance Trendline hurdle with Resistance Zone
- Bullish Cup and Handle pattern by the Resistance Zone neckline
- Rising Support Trendline seems well sustained
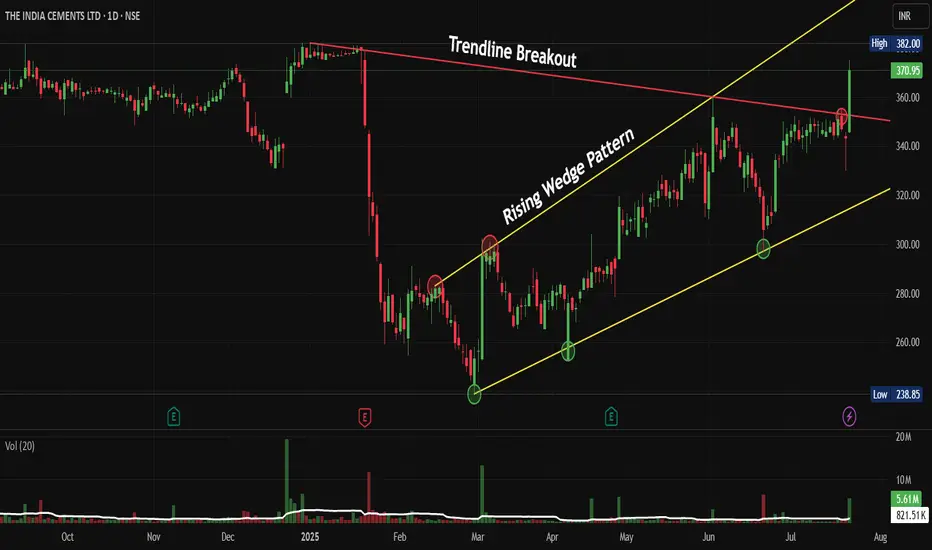
INDIACEM: Trendline Breakout Inside a Rising Wedge PatternNSE:INDIACEM Breaks Key Resistance: Is This the Start of a New Bull Run, after Ultratech Cement's Bullish Commentary Post Results?
Price Action:
• The stock has demonstrated a classic rising wedge pattern formation throughout 2025, indicating controlled accumulation
• Current price of ₹370.95 re
THE INDIA CEMENTS-Swing Trade Setup✅ Breakout completed
✅ Retest successful
✅ Trading above key moving averages
✅ Strong bullish candles recently
✅ Relative Strength is green on Daily & Weekly
✅ Cement sector showing strength
📊 Observations:
Clean range breakout from base
Volume spike on breakout day
Retest with demand wick

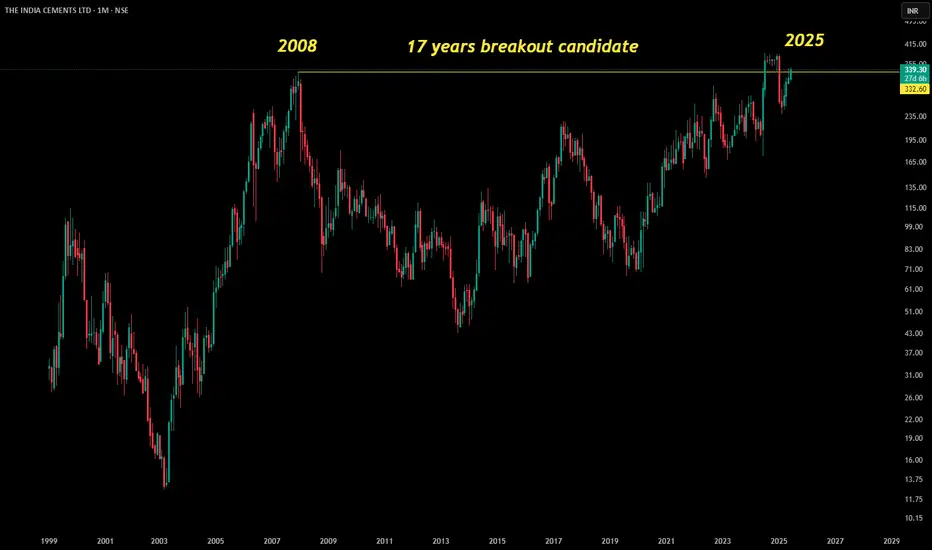
17 years breakout candidate INDIA CEMENTSThe image contains a summary of stock trades conducted in May 2025, listing key details such as trade date, stock names, buy price, exit price, and booked profit percentage. All trades are marked as "Closed," with profit percentages highlighted, showing positive returns in green and losses in red. T
India Cements Reversal TradeNSE:INDIACEM is looking good for a reversal trade as it bounced back from key levels which were the previous breakout zone where good buying was seen with Huge Volumes post the news of NSE:ULTRACEMCO acquisition.
About:
NSE:INDIACEM is a leading cement manufacturing company headquartered in

INDIACEM Bearishas we see this stock it has rallied 123% which is not a good sign as it has just shootup like a rocket expecting good profit booking / good retracement has to happen, Just a view not a Reco...

SWING (OBSERVATION) - INDIA CEMENTS
Script broke down major trendline support and support area, right now trading near support area around 300, can lead to next support area around 275 and beyond if momentum continues

See all ideas
Summarizing what the indicators are suggesting.
Neutral
SellBuy
Strong sellStrong buy
Strong sellSellNeutralBuyStrong buy
Neutral
SellBuy
Strong sellStrong buy
Strong sellSellNeutralBuyStrong buy
Neutral
SellBuy
Strong sellStrong buy
Strong sellSellNeutralBuyStrong buy
An aggregate view of professional's ratings.
Neutral
SellBuy
Strong sellStrong buy
Strong sellSellNeutralBuyStrong buy
Neutral
SellBuy
Strong sellStrong buy
Strong sellSellNeutralBuyStrong buy
Neutral
SellBuy
Strong sellStrong buy
Strong sellSellNeutralBuyStrong buy
Displays a symbol's price movements over previous years to identify recurring trends.
MOSMALL250
Motilal Oswal Nifty Smallcap 250 ETF Units Exchange Traded FundWeight
0.09%
Market value
13.63 K
USD
MULTICAP
Mirae Asset Nifty500 Multicap 502525 ETF Exchange Traded Fund UnitsWeight
0.02%
Market value
1.37 K
USD
Explore more ETFs
Frequently Asked Questions
The current price of INDIACEM is 412.15 INR — it has increased by 9.75% in the past 24 hours. Watch India Cements Ltd. stock price performance more closely on the chart.
Depending on the exchange, the stock ticker may vary. For instance, on BSE exchange India Cements Ltd. stocks are traded under the ticker INDIACEM.
INDIACEM stock has risen by 3.59% compared to the previous week, the month change is a 2.11% rise, over the last year India Cements Ltd. has showed a 11.08% increase.
We've gathered analysts' opinions on India Cements Ltd. future price: according to them, INDIACEM price has a max estimate of 450.00 INR and a min estimate of 300.00 INR. Watch INDIACEM chart and read a more detailed India Cements Ltd. stock forecast: see what analysts think of India Cements Ltd. and suggest that you do with its stocks.
INDIACEM reached its all-time high on Oct 30, 2025 with the price of 429.90 INR, and its all-time low was 26.00 INR and was reached on Jun 24, 2004. View more price dynamics on INDIACEM chart.
See other stocks reaching their highest and lowest prices.
See other stocks reaching their highest and lowest prices.
INDIACEM stock is 10.50% volatile and has beta coefficient of 0.85. Track India Cements Ltd. stock price on the chart and check out the list of the most volatile stocks — is India Cements Ltd. there?
Today India Cements Ltd. has the market capitalization of 116.38 B, it has decreased by −1.06% over the last week.
Yes, you can track India Cements Ltd. financials in yearly and quarterly reports right on TradingView.
India Cements Ltd. is going to release the next earnings report on Jan 23, 2026. Keep track of upcoming events with our Earnings Calendar.
India Cements Ltd. revenue for the last quarter amounts to 11.17 B INR, despite the estimated figure of 10.65 B INR. In the next quarter, revenue is expected to reach 10.60 B INR.
INDIACEM net income for the last quarter is 88.10 M INR, while the quarter before that showed −1.33 B INR of net income which accounts for 106.63% change. Track more India Cements Ltd. financial stats to get the full picture.
As of Dec 5, 2025, the company has 2.88 K employees. See our rating of the largest employees — is India Cements Ltd. on this list?
EBITDA measures a company's operating performance, its growth signifies an improvement in the efficiency of a company. India Cements Ltd. EBITDA is −287.60 M INR, and current EBITDA margin is −8.97%. See more stats in India Cements Ltd. financial statements.
Like other stocks, INDIACEM shares are traded on stock exchanges, e.g. Nasdaq, Nyse, Euronext, and the easiest way to buy them is through an online stock broker. To do this, you need to open an account and follow a broker's procedures, then start trading. You can trade India Cements Ltd. stock right from TradingView charts — choose your broker and connect to your account.
Investing in stocks requires a comprehensive research: you should carefully study all the available data, e.g. company's financials, related news, and its technical analysis. So India Cements Ltd. technincal analysis shows the buy rating today, and its 1 week rating is buy. Since market conditions are prone to changes, it's worth looking a bit further into the future — according to the 1 month rating India Cements Ltd. stock shows the buy signal. See more of India Cements Ltd. technicals for a more comprehensive analysis.
If you're still not sure, try looking for inspiration in our curated watchlists.
If you're still not sure, try looking for inspiration in our curated watchlists.