IOB 1 Week View📊 Key Technical Indicators
Moving Averages: The stock is trading below its 5-day, 50-day, and 200-day moving averages, all indicating a sell trend.
Relative Strength Index (RSI): The 14-day RSI stands at 39.62, suggesting the stock is in a neutral to bearish condition.
MACD: The MACD is negative, reinforcing the bearish trend.
📈 Support and Resistance Levels
Support Levels: ₹37.84 (weekly pivot), ₹37.56 (short-term support), ₹36.07 (lower range of horizontal trend).
Resistance Levels: ₹39.75 (weekly pivot), ₹39.59 (near-term resistance), ₹41.08 (upper range of horizontal trend).
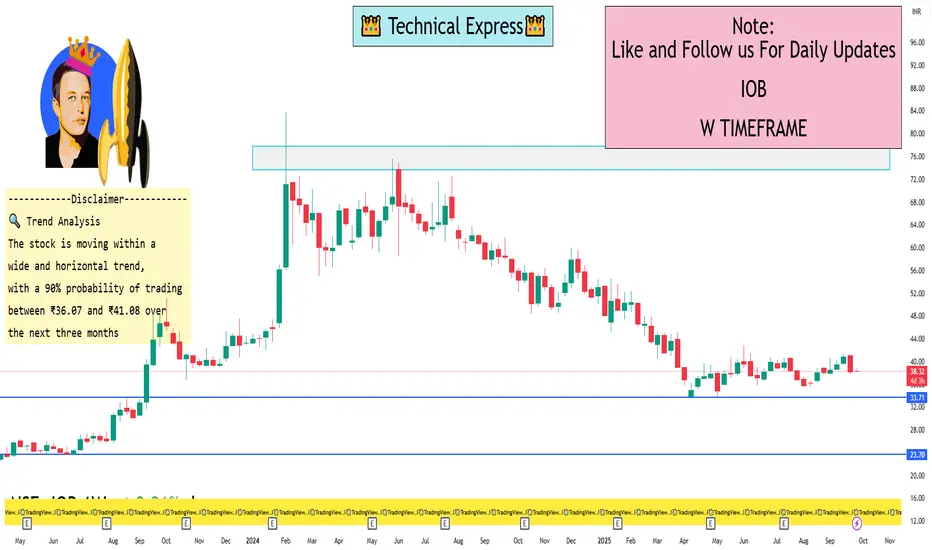
🔍 Trend Analysis
The stock is moving within a wide and horizontal trend, with a 90% probability of trading between ₹36.07 and ₹41.08 over the next three months.
⚠️ Outlook
The prevailing trend is bearish, with no significant positive signals at the moment. A break above the resistance levels could indicate a potential reversal, but currently, the stock remains under pressure.
Trade ideas
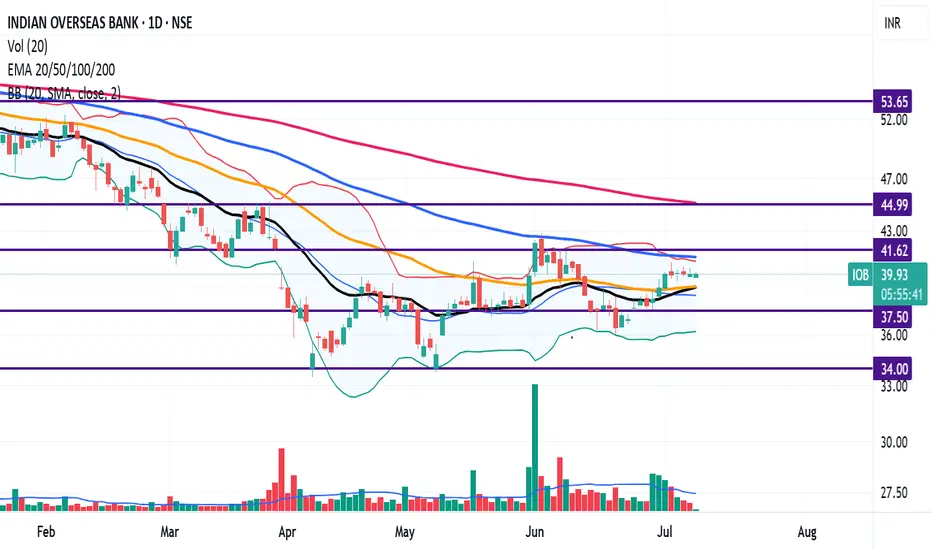
Stock turning Bullish: Indian Overseas Bank (IOB)IOB is taking strong support around 20 EMA (Black Line),
We can confirm the bullish trend in the stock when 20 EMA (Black Line) cross above 50 EMA (Orange Line) decisively in the weekly chart.
IOB is 44.86% away from 52 week high and
19.49% away from 52 week low
The stocks is showing Mid Range Momentum when compared to Short, Medium and Long Term Moving Averages
Resistance levels: 41.6, 45, 54
Support levels: 37.5, 34
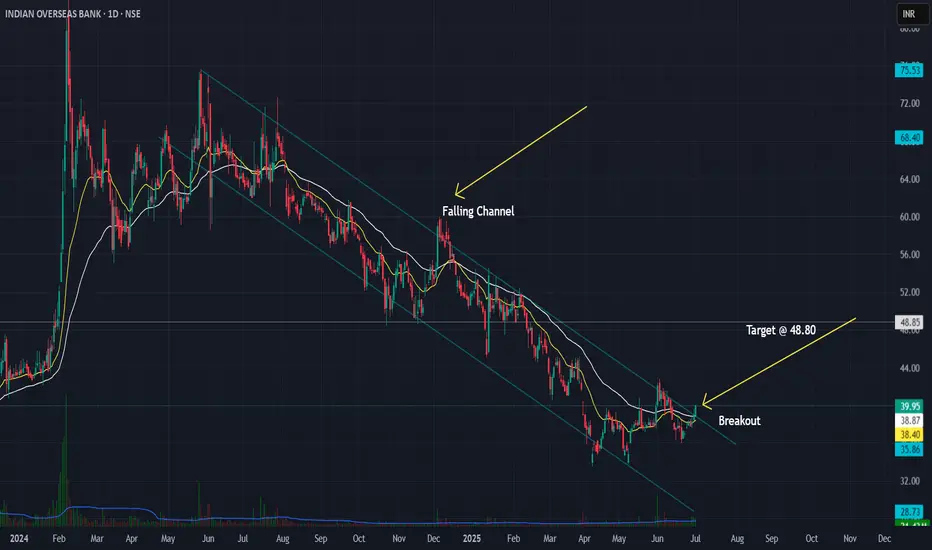
Indian Overseas Bank (IOB) - Falling Channel Breakout Setup📈 Indian Overseas Bank (IOB) – Falling Channel Breakout Setup
Watching a classic falling channel on the daily timeframe with multiple touches on both trendlines. Recent breakout above ~38.8 confirms the channel break.
✅ Planned Trade Details:
- Entry above 38.8 (confirmation)
- Stop-loss: 35.90
- ATR-based stop option: ~37.45 for tighter risk control
- Target zone: 48.80 based on channel height projection
Volume confirmation and follow-through will be key for validating the breakout. Tracking this for a positional swing trade.
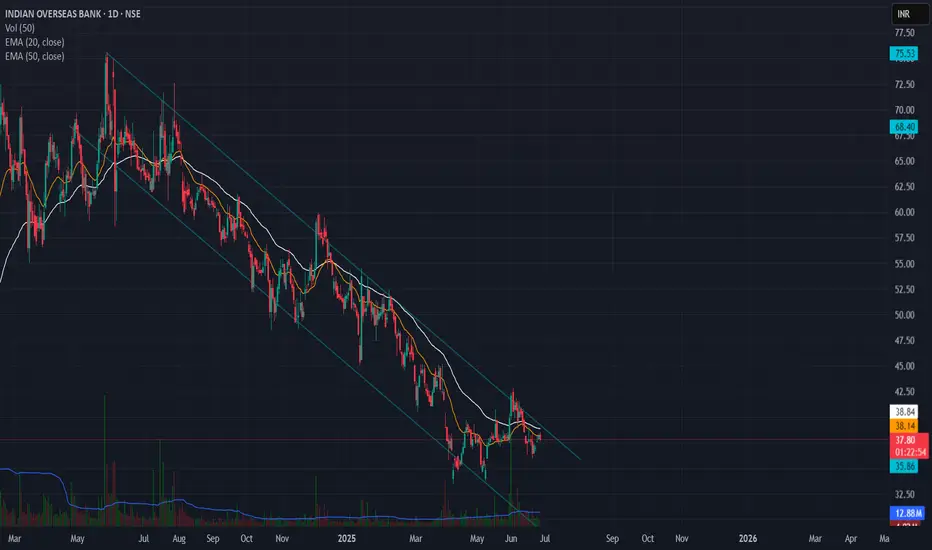
Falling Channel Pattern in Indian Overseas Bank📉 IOB (Indian Overseas Bank) - Falling Channel Setup
🔍 Daily Chart Analysis – June 26, 2025
IOB has been trading within a well-defined falling channel since early 2024. Price is currently testing the upper boundary of the channel but hasn’t confirmed a breakout yet.
🔑 Key Observations:
Structure: Clearly respecting the falling channel.
Moving Averages: Price is hovering around short-term EMAs (20 & 50) and below the both EMA, indicating weak momentum.
Volume: No significant volume surge yet to support a breakout.
Confirmation needed: A close above the trendline (~₹39–40) with volume would be an early sign of bullish reversal.
🎯 Watch for:
Breakout above ₹40 with increased volume = potential short-term rally.
Failure to break may result in retesting lower channel support near ₹33–34.
🧠 Adding this to my breakout watchlist. Will reassess if it closes outside the channel.
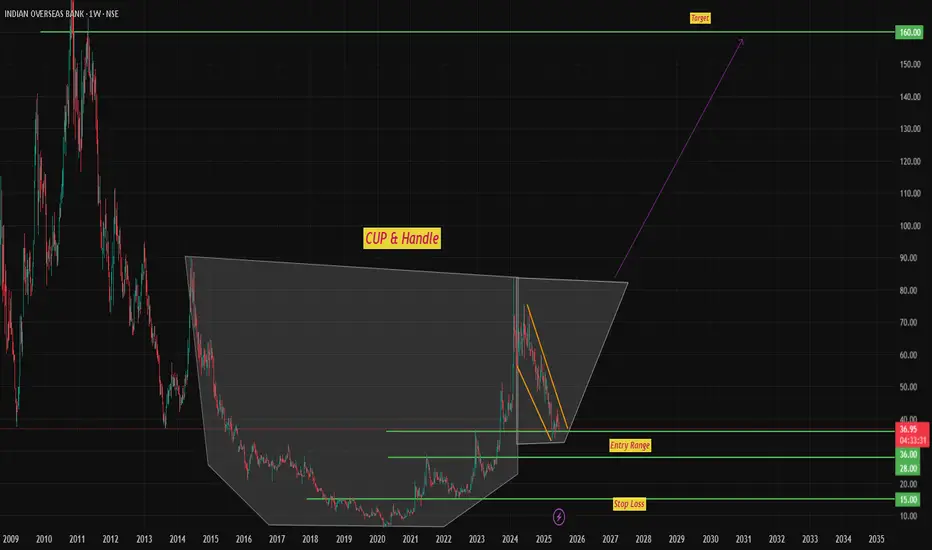
Weekly cup & Handle patternIndian Overseas Banks, weekly time frame formed Cup and Handle pattern.
IOB has made progress in improving its financial health, particularly in reducing NPAs and increasing profitability. However, it needs to address the challenges related to ROA, cost-to-income ratio, and fluctuating quarterly results. A focus on digital transformation, market expansion, and strengthening partnerships can help IOB capitalize on growth opportunities. Investors should carefully consider both the strengths and weaknesses before making any investment decisions.
This chart is self-explanatory about entry stop loss and estimated target. One should understand that this chart prepared for the long term investment purpose.
Note: I am not a certified authorized stock analyst, please do your own financial assessment before you invest.
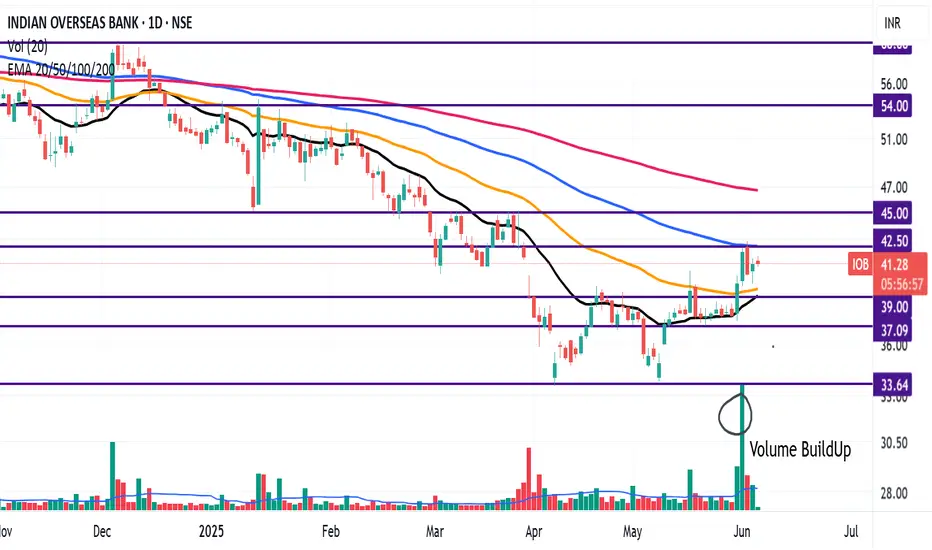
Turning Bullish: IOBIOB is trading above 20 EMA (black Line), 50 EMA (Orange Line), and nearing the 100 EMAs (Blue Line) However, it is well below the 200 EMA (Pink line).
Recently the stock turned bullish, after taking support around 20EMA.
Volume Buildup also confirms the change in trend.
We have seen spurt in volume in the last few sessions, however, on weekly chart the 20 EMA (Black line) has to traverse above the 50 EMA (Orange line) to confirm the Bullish trend.
Resistance levels: 43, 45, 53, 60
Support levels: 39, 37, 33
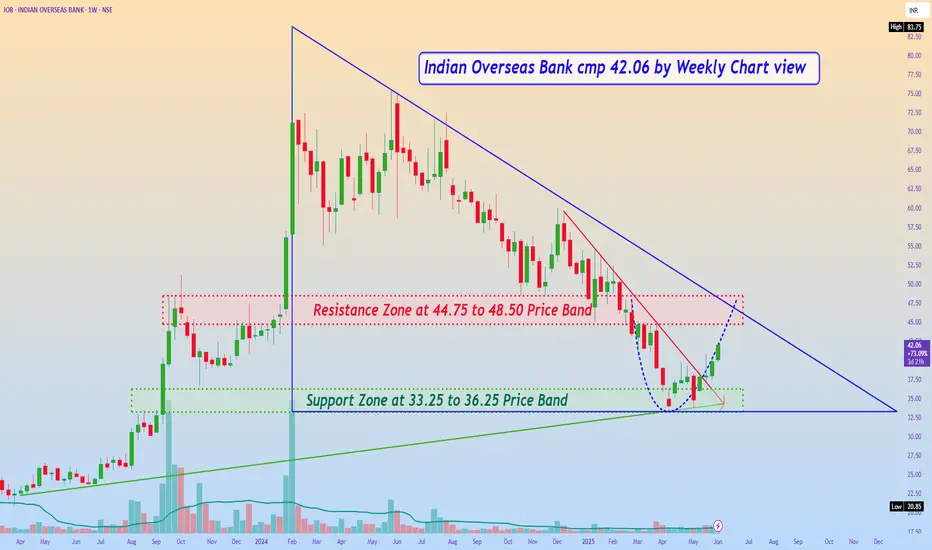
Indian Overseas Bank cmp 42.06 by Weekly Chart viewIndian Overseas Bank cmp 42.06 by Weekly Chart view
- Support Zone at 33.25 to 36.25 Price Band
- Resistance Zone at 44.75 to 48.50 Price Band
- Volumes are seen increasing gradually week over week
- Bullish Rounding Bottom in the making at Resistance Zone neckline
- Chart setup indicates a Descending Triangle Breakout seemingly in positive progress
IOB can rise after PSU stake saleI feel that all PSU banks are well positioned to move up
The ones that have the highest chances of getting sold off are IOB, central Bank as of now
Rumours of their Privatisation have been going around for a while

IOB - Progressive Cup & Handle - QuarterlyGood Progressive Cup & Handle Formation. Handle is yet to form a definite shape but it will soon.
Can accumulate at this levels and wait till the breakout above 65.
Target 1 122 in about 6-8 months
Target 2 142 in about 12 months
Please do check the fundamentals though.

The trend is strong IOB CM 52.14
Fibs- the retracement to 50% of the swing is strength. This means the trend is intact and strong.
Trendline- break of the falling trendline and retest is positive.
RSI- +ve divergence at support is indication of reversal. On the second dip the RSI is now taking support above the bull zone. This is again positive.
Conclusion - the stock will go minimum to the top which is 75. This is a good 45% from here.

A perfect U shaped recoveryIOB CMP 59.46
In my view the next big rally will happen in banks and NBFC's.I mentioned housing finance companies a few months back. They are already flying. Next are banks and NBFC's.

Indian Overseas Bank @ 59.71Sector: Bank - Public
52 Week High 83.75
52 Week Low 24.45
All Time High 227.45
All Time Low 6.05
Book Value Per Share 12.18
Sector PE 11.47
Face Value 10
Beta 2.05
Mkt Cap (Rs. Cr.) 112,866
As long as 29/6 holds support and break of 84, we can see 160 first and further 233+
NOTE: Not a BUY or SELL SIGNAL.
All updates are only for the educational and knowledge purpose.

Stock in Downtrend with potential reversal: IOBIOB has been in a downtrend for some time.
Decent growth in ROCE (11.13%) compared to Prv Yr (8.95%) and 3Yr Avg ROCE (9.53%).
Similarly, there was a decent growth in ROE (11.35%) compared to Prv Yr (10.03%) and 3Yr Avg ROCE (10.43%).
IOB has strong support around 56 - 48 levels.
Can enter around 60 levels for a target of 75 - 80 levels in the short to medium term.

IOB in samosaIOB in samosa
this is the same pattern i shared in IREDA at 190 it went to 300
so keep eye
1 day selling, removing toddlers from market.
I am not SEBI registered

IOBIOB is currently at descending trendline resistance which connects jan2008,nov2010,apr2011, and feb2024, however consolidated for the last 23 weeks in a range approx 59-71 above trendline support which connects jan2013/jun2014. can take 1st entry closing abv 71 on weekly and pyramid the position once it breaks the descending trendline around the 80 level and then around 90-95.


Public Sector Banks looking goodAs per weekly and daily chart, a range bound consolidation seen and this consolidation is likely to be broken on higger side, so in the short term, IOB, CBI, UCO BANK, PNB, these PSBs can give 50 to 80 % gain in less than one month, so one can take position in PSBs.

IOB BreakoutDaily chart broke out from three times resistance, and just a few days ago, RSI55 showed this breakout.
I am bullish on this company for near term.


#IOB #Ready For Rocket 🚀 Indian Overseas Bank (IOB) Stock Ready For Rocket ...Today Stock Crossed There Range & Breakout 10% above ..
Banking Sector Today Bullish & Green Signal For This Week
Technically Breakout + Strong Fundamental Growth On Sales & Net Profit
Weekly Support 60 RSI

PSU Banks are looking NicePSU Banks are looking Nice📊
IOB
+ Symmetrical Triangle Pattern
+ Bullish Sector
+ Volatility & Volume Contraction
+ Above Key EMAs
-: Not a Buying recommendation

Symmetrical triangle pattern Symmetrical triangle pattern
IOB
+ Prior uptrend with Volume
+ Low volume during base Formation
+ above Key EMAs
-: Not a Buying recommendation

IOB from strong sector seems to break resistance. -EPS Growth, GNPA/NNPA decreasing, NIM Increasing
-Testing Resistance forth time, all good PSUBANK stocks setting up.
Check Vol
