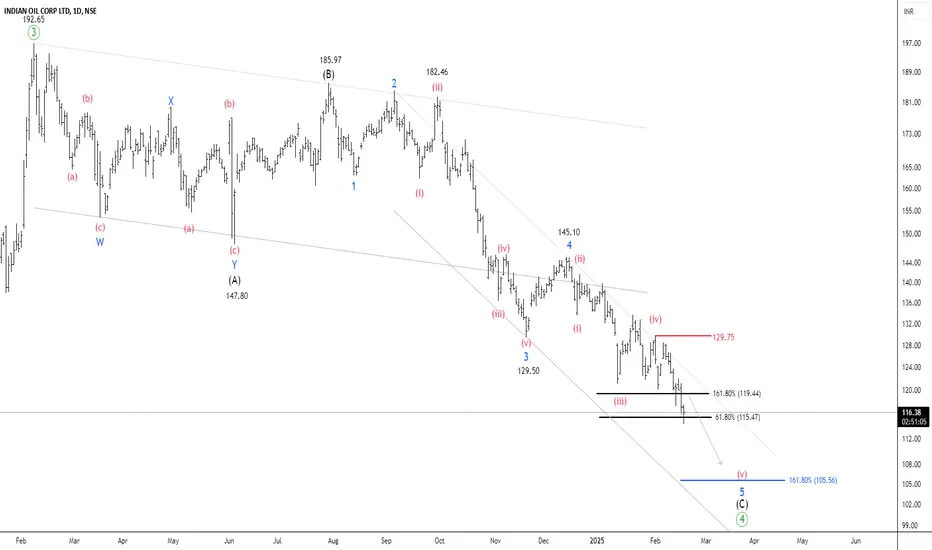
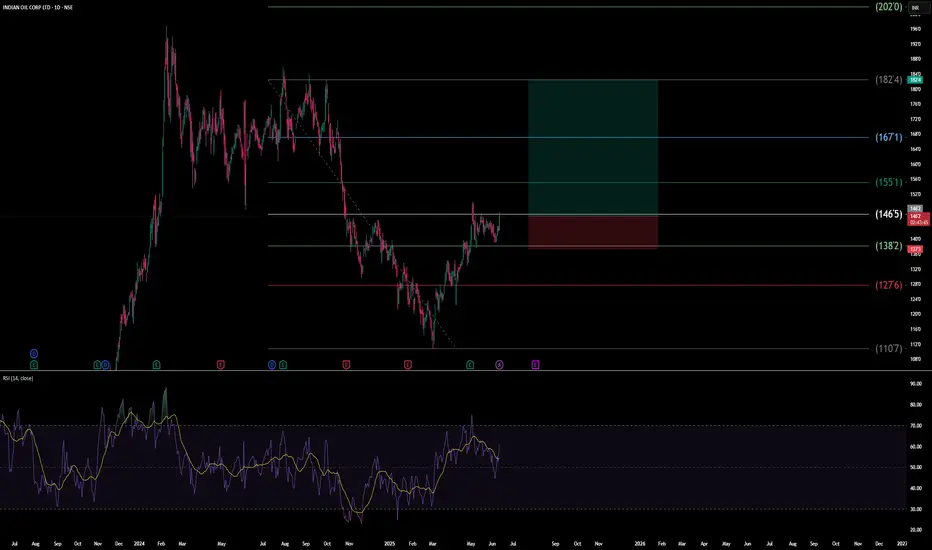
NSE IOC – Approaching a Key Demand ZoneTimeframe: Daily
After reaching a high of 196.8, the price has declined by over 39% in 13 weeks. It is currently trading below the 50/100 EMA band, with ATR at 3.68 and ADX at 26.02 . According to the Elliott Wave projection, the peak of 196.80 can be identified as a wave ((3)). The security is currently undergoing the formation of a corrective wave (4).
Wave (B) formed at 185.97 , while wave 4 of wave (C) was completed at 145.10 . NSE IOC is now setting up for the final wave 5 of wave (C).
Two key Fibonacci relationships help estimate the end of the correction:
1.618 Fibonacci extension of wave (A) at 106.54 (for wave C)
0.618 Fibonacci extension of wave 1 at 115.52 (for wave 5)
The price is expected to settle between 115 and 105 , which serves as a key demand zone for buyers. If the price breaks out and sustains above 129.75, traders can target the following levels: 139 – 156 – 172+.
we will update further information soon.
IOC trade ideas
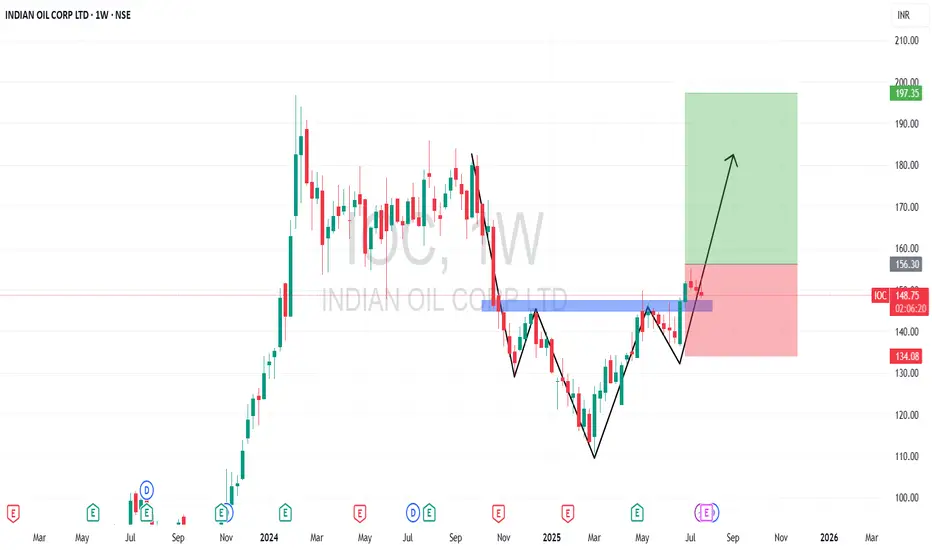
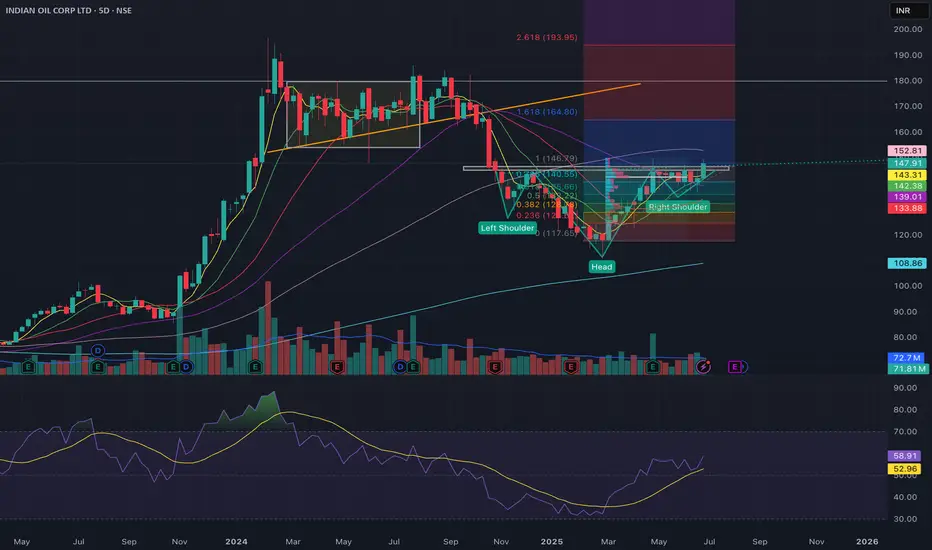
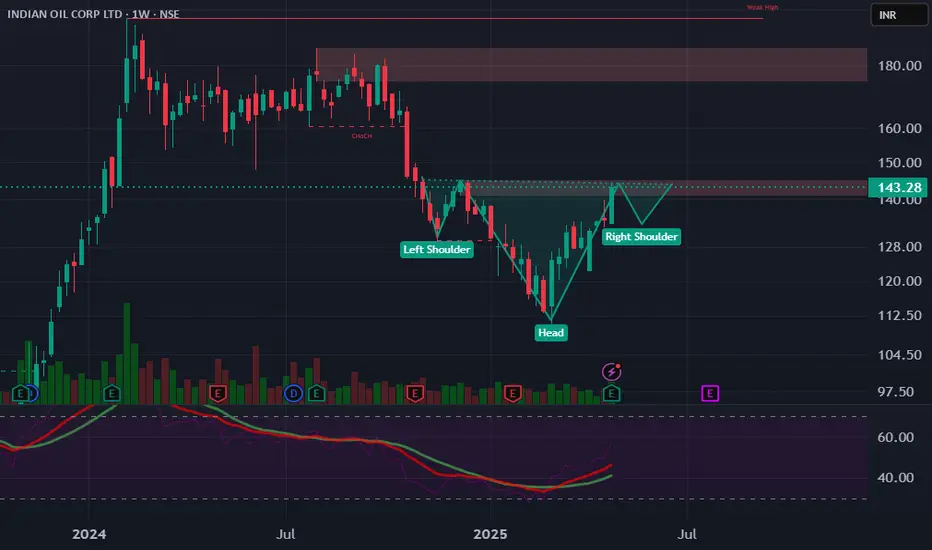
Strong Reversal Backed by Breakout and Robust Q4I am speaking about the IOC Ltd stock. Technically, I’ve been observing this stock’s chart for over two decades. In Feb 2024, it created an All-Time High at ₹197. From there, it consolidated till Sept 2024, followed by a sharp correction to ₹110 by March 2025. This ₹110 level acted as a strong demand zone and the stock rallied sharply from there.
Currently, it's trading at ₹152, forming an Inverse Head & Shoulder pattern, and the price has already broken above the neckline — a bullish signal.
🎯Targets
Target 1: ₹170
Target 2: ₹180
Target 3: ₹190
📉Stop Loss Levels
First Stop Loss: ₹135 (shoulder low)
Final Stop Loss: ₹110 (major demand zone)
💰Q4 FY24 Financial Highlights (vs Q3 FY24 & Q4 FY23)
Total Income:₹1,95,270 Cr (↑ flat vs ₹1,94,014 Cr; ↓ -2% vs ₹1,98,650 Cr)
Total Expenses: ₹1,80,241 Cr (↓ -3% vs ₹1,86,442 Cr; ↓ -4% vs ₹1,86,675 Cr)
Operating Profit: ₹15,029 Cr (↑ +98% vs ₹7,573 Cr; ↑ +25% vs ₹11,975 Cr)
Profit Before Tax: ₹10,045 Cr (↑ +263% vs ₹2,766 Cr; ↑ +35% vs ₹7,420 Cr)
Profit After Tax: ₹8,368 Cr (↑ +290% vs ₹2,147 Cr; ↑ +52% vs ₹5,488 Cr)
Diluted EPS: ₹5.75 (↑ from ₹1.50 QoQ; ↑ from ₹3.65 YoY)
🧾Fundamental Insights
🛢️IOC has benefited from softening crude oil prices and improved gross refining margins (GRMs), leading to better operating performance.
📦Strong inventory gains and better refining throughput also contributed to profitability.
💵The company declared a final dividend of ₹7 per share for FY24, rewarding shareholders amid solid earnings.
🏭Capex plans continue across petrochemical expansions and refinery upgrades, securing long-term growth.
🌱The management also highlighted a push toward energy transition — expanding green hydrogen and EV charging infrastructure.
Conclusion:
IOC Ltd is showing a strong technical breakout and backed by solid fundamentals in Q4. If the bullish pattern sustains, investors may see a retest of all-time highs in coming weeks.
Disclaimer: lnkd.in
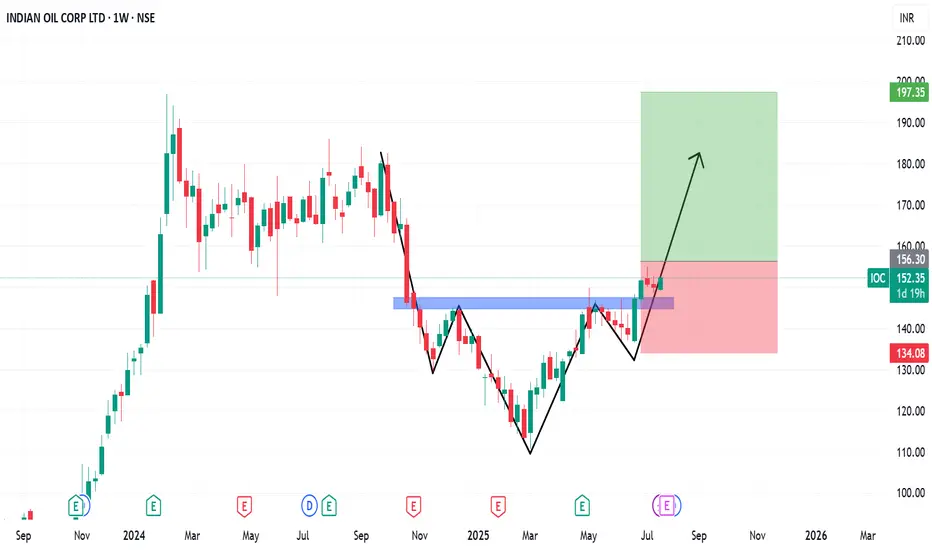
Strong Reversal Backed by Breakout and Robust Q4📈 Technical Analysis
I am speaking about the IOC Ltd stock. Technically, I’ve been observing this stock’s chart for over two decades. In Feb 2024, it created an All-Time High at ₹197. From there, it consolidated till Sept 2024, followed by a sharp correction to ₹110 by March 2025. This ₹110 level acted as a strong demand zone and the stock rallied sharply from there.
Currently, it's trading at ₹152, forming an Inverse Head & Shoulder pattern, and the price has already broken above the neckline — a bullish signal.
🎯 Targets
Target 1: ₹170
Target 2: ₹180
Target 3: ₹190
📉 Stop Loss Levels
First Stop Loss: ₹135 (shoulder low)
Final Stop Loss: ₹110 (major demand zone)
💰 Q4 FY24 Financial Highlights (vs Q3 FY24 & Q4 FY23)
Total Income: ₹1,95,270 Cr (↑ flat vs ₹1,94,014 Cr; ↓ -2% vs ₹1,98,650 Cr)
Total Expenses: ₹1,80,241 Cr (↓ -3% vs ₹1,86,442 Cr; ↓ -4% vs ₹1,86,675 Cr)
Operating Profit: ₹15,029 Cr (↑ +98% vs ₹7,573 Cr; ↑ +25% vs ₹11,975 Cr)
Profit Before Tax: ₹10,045 Cr (↑ +263% vs ₹2,766 Cr; ↑ +35% vs ₹7,420 Cr)
Profit After Tax: ₹8,368 Cr (↑ +290% vs ₹2,147 Cr; ↑ +52% vs ₹5,488 Cr)
Diluted EPS: ₹5.75 (↑ from ₹1.50 QoQ; ↑ from ₹3.65 YoY)
🧾 Fundamental Insights
🛢️IOC has benefited from softening crude oil prices and improved gross refining margins (GRMs), leading to better operating performance.
📦Strong inventory gains and better refining throughput also contributed to profitability.
💵The company declared a final dividend of ₹7 per share for FY24, rewarding shareholders amid solid earnings.
🏭Capex plans continue across petrochemical expansions and refinery upgrades, securing long-term growth.
🌱The management also highlighted a push toward energy transition — expanding green hydrogen and EV charging infrastructure.
Conclusion:
IOC Ltd is showing a strong technical breakout and backed by solid fundamentals in Q4. If the bullish pattern sustains, investors may see a retest of all-time highs in coming weeks.📊💹
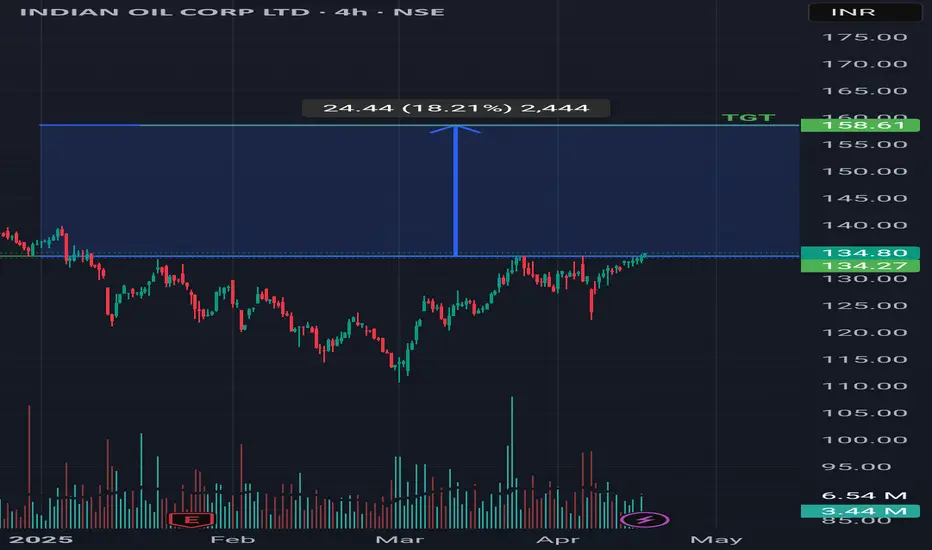
Indian Oil Corporation LtdEquity Swing buy - IOCL (Indian Oil Corporation Ltd)
Cmp - 152
Target - 158-159
{Not suggested/not recommended to buy or sell, consult your finanical advisor}

IOC - Breakout Candidate? Jump now or wait it out?
Levels are marked for easy/better understanding.
The chart looks like a clean breakout
But the following aspects makes me feel that it could give one DIP before resuming higher.
RSI looks stretched and trading in overbought territory on hourly and 4 hour TF
Weekly SuperTrend is at 152 levels and we are almost close; hence, expecting some sort of supply at this zone
Price tends to consolidate / pullback after strength candles at regular intervals
The open counts in P&F charts suggests 154, 162 and 180; But please dont bet on this view through Options. P&F charts primarily focus on Price and not TIME.. whereas Options are time sensitive.
At 135-140 it was a very good buy and it is ideally should head towards 160 and 170 levels. Since we focus on Low Risk set ups, better to wait it out.
Disclaimer: I am not a SEBI registered Analyst and this is not a trading advise. Views are personal and for educational purpose only. Please consult your Financial Advisor for any investment decisions. Please consider my views only to get a different perspective (FOR or AGAINST your views). Please don't trade FNO based on my views. If you like my analysis and learnt something from it, please give a BOOST. Feel free to express your thoughts and questions in the comments section.
Indian Oil Corporation Limited (IOC)Indian Oil Corporation Limited (IOC), is India’s largest government-owned oil and gas company, operating under the Ministry of Petroleum and Natural Gas.
IOC continued to fall from October last year to March,2025.
And for within 2 months 50% return (145 level), it was this is amazing performance.Currently it's made a bullish flag pattern.
Friends! as per technical chart pattern I want to see in the coming days IOC near 175-180 level.

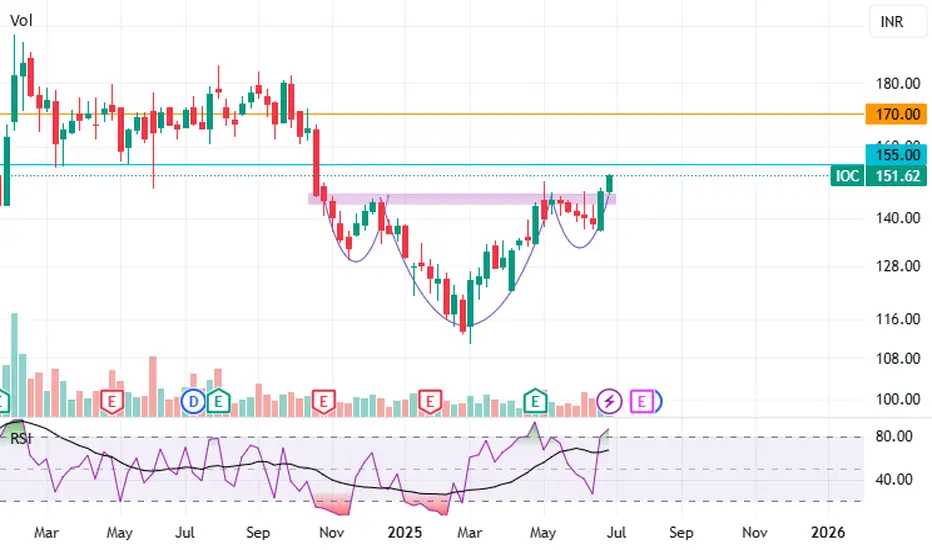
Indian Oil Corporation LtdIOC looks like a strong buy right now. It's got that cup and handle breakout, lots of trading volume, and good moving averages. If it stays above 155 with good volume, we could see it hit 170 soon. Keep 145 as a stop-loss.
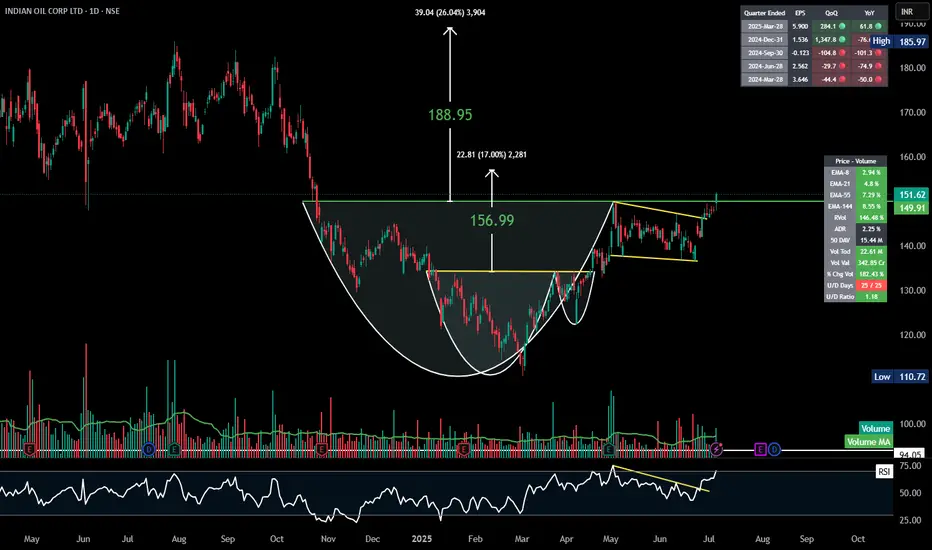
IOC | CupAndHandle | Daily#IOC – #CupAndHandle #Breakout ⛽
Classic BO after long consolidation with strong volume push!
📍 BO Level: ₹150
🎯 Resis: ₹188.95 (+26%)
🛡 Stoploss: ₹147
✅ RSI bullish divergence → breakout
✅ Volume surge >180%
✅ Textbook cup → handle → pennant → breakout sequence
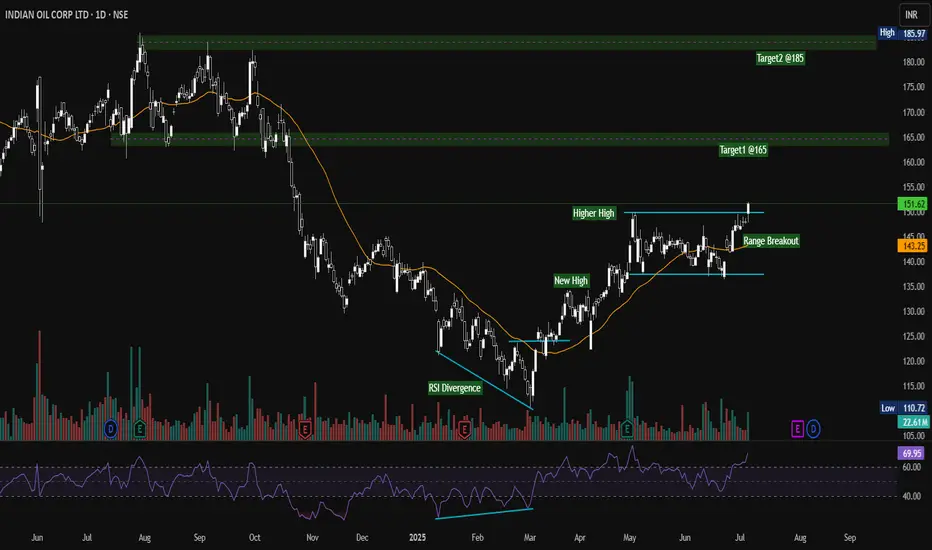
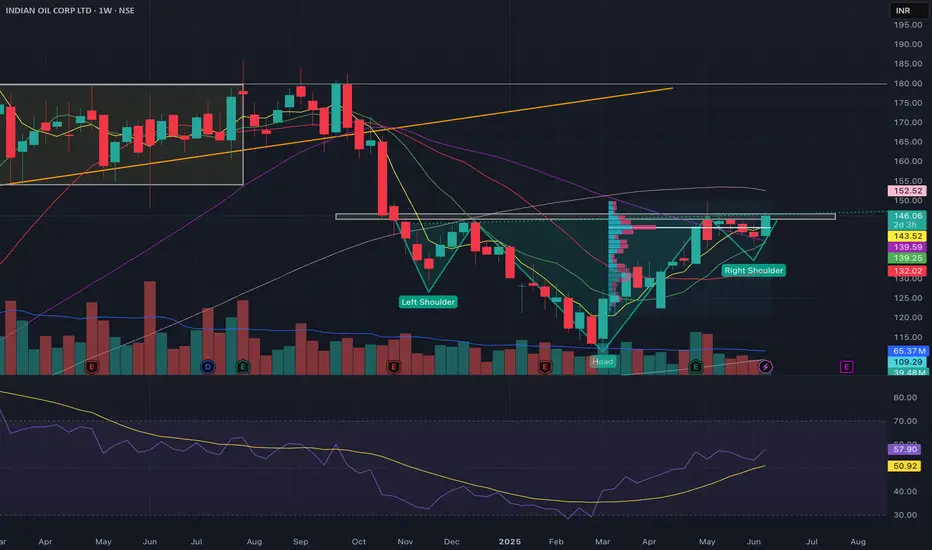
IOC Range Breakout Confirmed | Bullish Momentum Building Toward NSE:IOC – Strong Bullish Setup with Range Breakout | Targets: ₹165 & ₹185
Indian Oil Corp Ltd (IOC) has shown a decisive breakout from a prolonged consolidation range, signaling strong bullish momentum. Price has crossed the resistance zone around ₹150–₹151 with significant volume, confirming the breakout.
Key Technical Highlights:
RSI Bullish Divergence: Notable RSI divergence spotted near February lows, which was a precursor to the ongoing reversal.
Trend Reversal Confirmation:
New High formed in March 2025
Higher High confirmed in May 2025
20 EMA (orange) is trending upward and has acted as dynamic support.
Range Breakout occurred recently, marking the start of the next bullish leg.
Upside Targets:
Target 1: ₹165 – Previous supply zone and horizontal resistance
Target 2: ₹185 – Major resistance zone and previous swing high
Indicators:
RSI: Currently at 69.95, near overbought but supports continuation in strong uptrends
Volume: Breakout accompanied by a volume spike – strong institutional activity
Support:
Immediate support at ₹143 (previous range high and breakout level)
Bias: Bullish
Timeframe: Daily
Trade Setup: Buy-on-dips or breakout retest entry
Disclaimer: Not financial advice. Please do your own research or consult a registered financial advisor.
IOC all set to give a breakout till 165INV H&S in completion & consolidating at the resistance.
RSI divergence with strength.
MA supports.
CMP: 148, SL: 130, TGT: 165, long term target 180
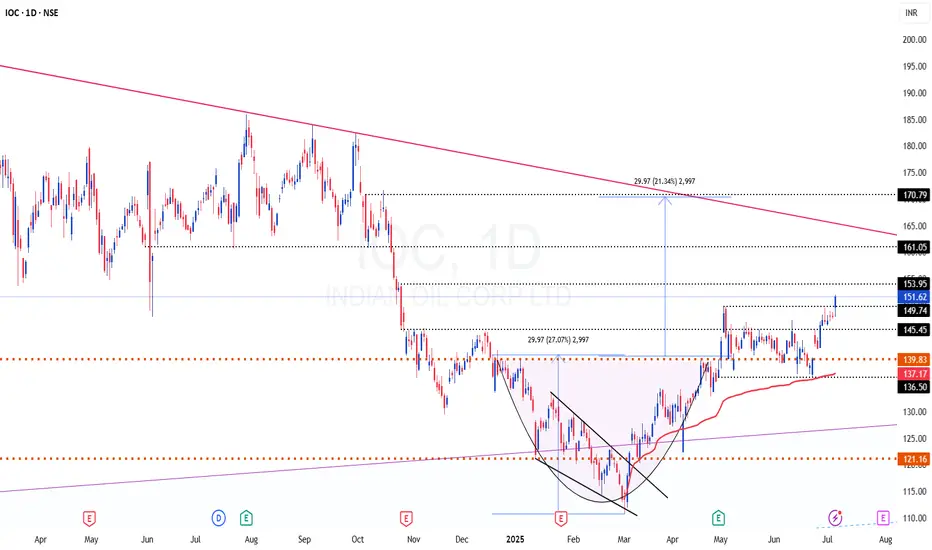
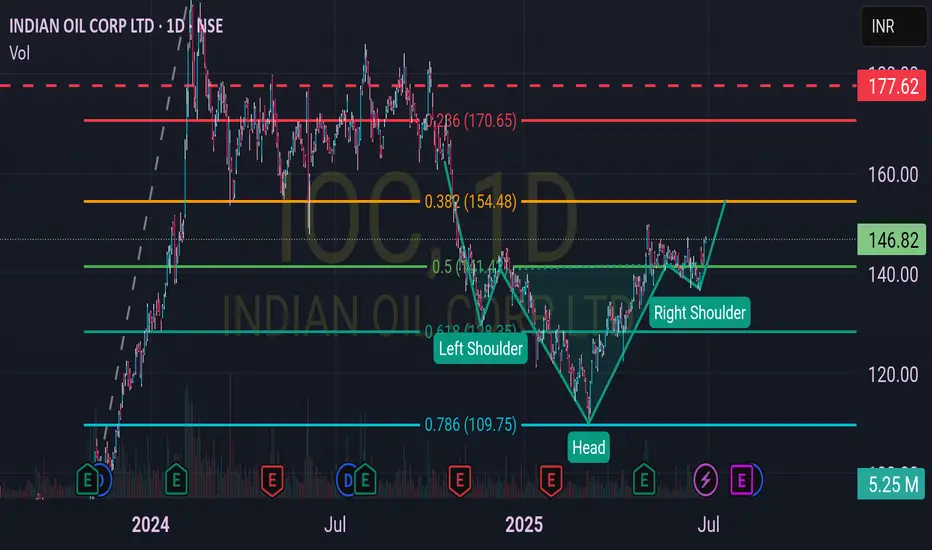
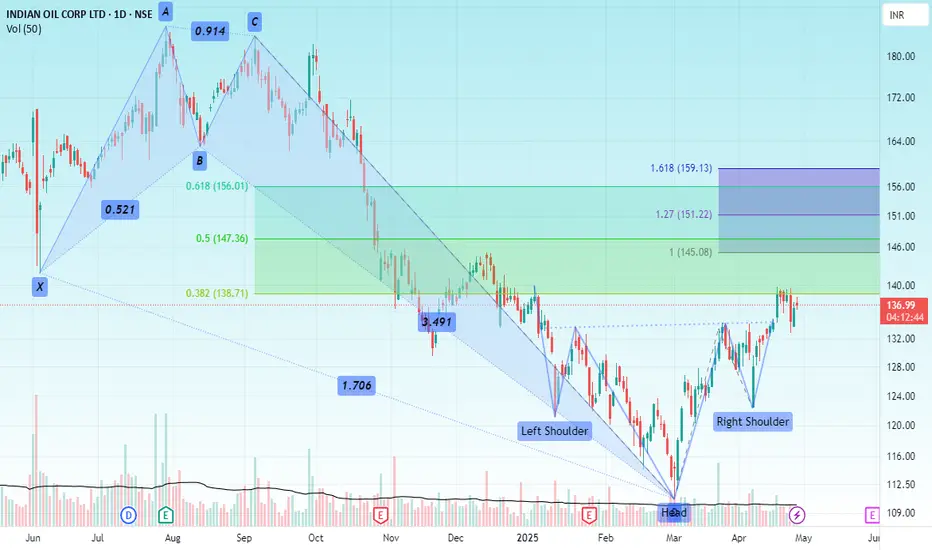
IOC - Fascinated by the Fibonacci!
Unveil the mesmerizing journey of Indian Oil Corp Ltd (IOC) on this captivating chart!
Behold the Fibonacci levels, meticulously drawn two months ago, revealing a fascinating truth.
Witness the price action align flawlessly with these golden ratios, a trader's dream come true.
Marvel at the emerging head and shoulder pattern, hinting at a potential trend reversal.
Anticipate an exhilarating uptrend as the pattern nears completion, sparking excitement.
Strategize with a trailing stop from entry, safeguarding your gains with precision.
Embrace proper risk management to navigate this thrilling market adventure.
The 0.618 level at ₹154.48 and 0.786 at ₹109.75 have held strong, guiding the price.
The current price of ₹146.73 teases a breakout, aligning with the right shoulder.
Prepare for an upward surge, blending Fibonacci magic with pattern perfection!
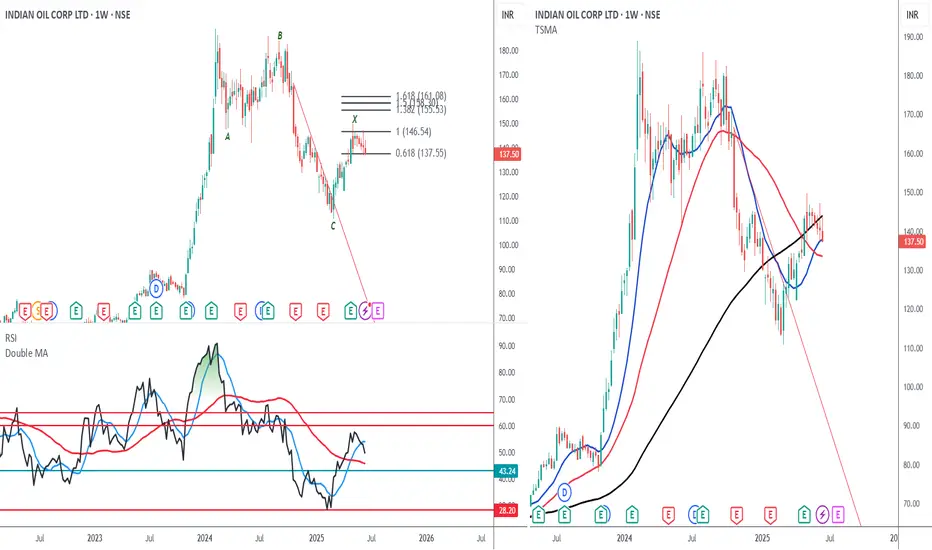
the correction has resumedIOC CMP 137.42
Elliott- The rally is a zig zag and is over. Since it is corrective we call it X. Now a new set of A, B , C correction will happen from here.
Fibs- the rally cannot go past 50% is weakness.
RSI - the oscillation within the bear zone is telling that the trend is still down.
MA- now trading below the longest MA is negative.
Conclusion - this stock is in my negative list. And now the correction has resumed. First tgt is back to the base at 110.
IOCL all set for a 10% upsideINV H&S completed in W.
RSI strength with divergence.
Taken support on the MA.
SL:135, CMP: 146, TGT:180
IOC at a brink of breaking it IHS neck line.A Paper Trade Idea on IOC
CMP 146.
It is at brink of breaking the neckline. at 146.7
Price Actions show strong Higher Low patterns.
Looks like it is a valid reversal pattern following a steep correction.
Conservative SL at 3% from cmp of 146.3
Aggressive SL at 6% from CMP.
I am Not a SEBI registered RA> this is just an paper trade Idea. Real trades are at your own risk
Indian Oil Corporation Ltd – Is This a Fresh Breakout?📝 Technical Analysis:
This stock has just broken out of a consolidation range, gaining momentum after taking support at the 50 EMA — a healthy sign of trend continuation.
It is now showing early signs of a Golden Cross, which could further strengthen the bullish sentiment.
📊 RSI: Currently supportive, indicating buying strength without being in the extreme overbought zone.
💰 Fundamental Note:
The company is cash-rich, and the dividend yield has historically ranged between 7.5% to 8%, making it attractive from an income perspective as well.
⸻
Analysis By Mayur Jayant Takalikar --For
LEARNING & OBSERVATIONAL USE ONLY.
⚠️ Disclaimer:
I am not a SEBI-registered advisor. This post is for educational and informational purposes only. Please consult a SEBI-registered financial advisor before taking any investment decision.

IOC - Poised for good up Move?After a big drop of nearly 40 percent from the top, the stock started consolidating and moving up, making a nice rounding bottom type of pattern. It started making higher highs and higher lows and moving past the short-term moving averages. Now, it has also gone past the 200 DMA and also crossing above an important pivot. We can see all the parameters like the relative strength, money flow, absolute strength are all positive. Also, it has come out with very good results for the fourth quarter with a good jump of nearly 58 percent in net profit. We can see the volume is also increasing along with the buying pressure. Now it is setting up nicely for a big up move. So this is a stop we should be watching.

IOC LTDIOC
BUY
Entry price above: 145 Target 155/165
Stop loss 138
Time period: Swing/Positional call
After crossing 145 levels stock can show a good up move. Good reports are also there.
I am just representing my views For educational purposes only.

Inverse Head and Shoulders Pattern - IOCIndian Oil Corporation
Indian Oil Corporation Ltd is a Maharatna Company controlled by GOI that has business interests straddling the entire hydrocarbon value chain - from Refining, Pipeline transportation and marketing of Petroleum products to R&D, Exploration & production, marketing of natural gas and petrochemicals. It has the leadership position in the Oil refining & petroleum marketing sector of India.
Current Price ₹ 143
Stock P/E 16.7
Industry PE 20.2
Stock now trade November 2024 onwards stock pattern formed. May month pattern completed shortly. Once pattern completed Next Final Target 180+
IOC pattern Inverse head and shoulder pattern complete may month end, shortly breakout will happen. Now stock trade 143 shortly will come down right shoulder 130 below and next upside move 145 . Once close 145 above start uptrend.
Final Target 180+
IOCHello & welcome to this analysis
A deep 6 months correction lead to the formation of a Bullish Harmonic Crab pattern in March 2025 post which during accumulation (consolidation) phase formed an Inverse Head & Shoulder.
A 38% retracement of the bullish harmonic pattern has been done and now its completing a pullback of the IHS breakout by retesting the neckline.
Potential upside levels are 145 and 160 for both the IHS & Bullish Harmonic Crab
All the best
Indian Oil Corporation LtdAs of May 2, 2025, the key intraday support and resistance levels for Indian Oil Corporation Ltd (NSE: IOC) are as follows:
Immediate Support Levels:
₹131.75
₹130.22
Immediate Resistance Levels:
₹138.63
₹146.46
These levels are derived from technical analysis and are subject to change based on market conditions.

IOC- Long1. Price & EMA Analysis
10 EMA (red) and 20 EMA (green) are sloping upward, with price trading above both:
This indicates short-term bullish momentum.
A recent bullish crossover between the 10 EMA and 20 EMA (10 crossing above 20) confirms short-term trend reversal. 200 EMA (blue) is still above current price, but the stock has closed just above it:
This is crucial — closing above the 200 EMA suggests a potential transition to long-term bullishness.
Needs confirmation with follow-up candles and volume.
2. Volume Analysis
Volume bar on the breakout candle (May 2) is significantly higher than previous sessions:
This confirms strong buying interest.Higher volume with a breakout above the 200 EMA and the 0.382 Fibonacci level (138.04) adds credibility to the move.
3.Fibonacci Retracement (from ₹182.24 to ₹110.72)
Price Levels:
0.236 level – ₹127.60 (Successfully held as support in March)
0.382 level – ₹138.04 (Broken with volume – now a support zone)
0.5 level – ₹146.48 (Next resistance level)
0.618 level – ₹154.92
0.786 level – ₹166.93
1.0 level – ₹182.24 (Swing high)
The stock has now entered a Fibonacci retracement recovery zone.
Holding above ₹138 with strength could lead to a target zone of ₹146–₹154 in the short term.

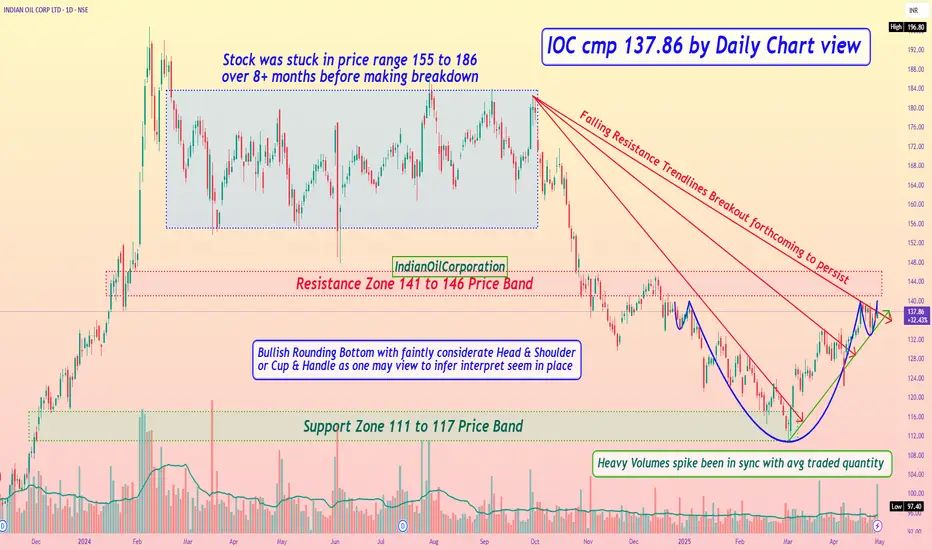
IOC cmp 137.86 by Daily Chart viewIOC cmp 137.86 by Daily Chart view
- Support Zone 111 to 117 Price Band
- Resistance Zone 141 to 146 Price Band
- Heavy Volumes spike been in sync with avg traded quantity
- Falling Resistance Trendlines Breakout forthcoming to persist
- Stock was stuck in price range 155 to 186 over 8+ months before making breakdown
- Bullish Rounding Bottom with faintly considerate Head & Shoulder or Cup & Handle as one may view to infer interpret seem in place
BUY INDIAN OIL CORPORATION Buy ioc 134 keep the TGT 152 in short term
Showing good strength at breakout with broader market support.