IOC trade ideas
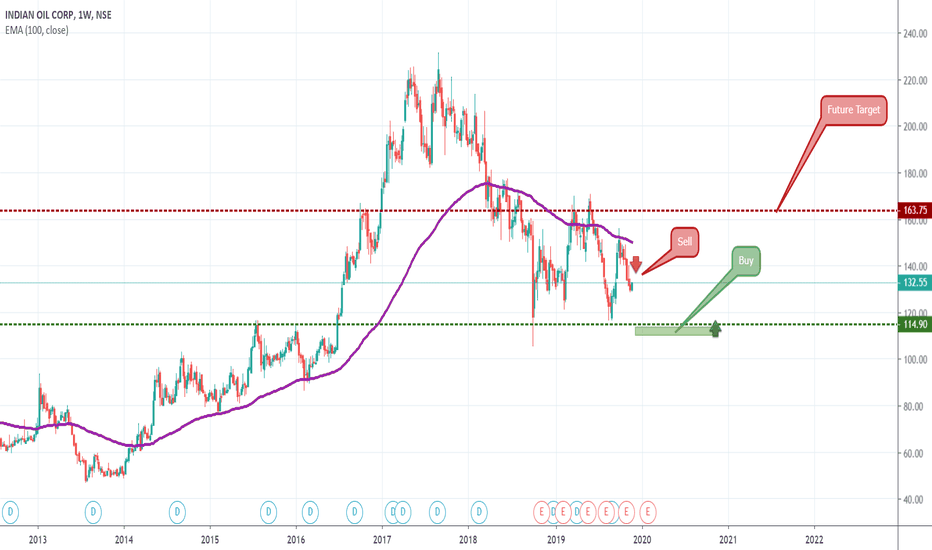
High probability trade Risk 2.5 Rupees Reward 35 rupees Buy at cmp on monday with a strict SL below 121.5
If it turns out to be right you can earn around 1 lakh + on one lot (in futures) however if it's wrong the max loss is 8-10 K
If trading in future buy Feb series future.
Suggestion and criticism is welcomed.
(Ideally as per harmonic trading you should trade this stock once it reaches level of 160 for shorting but i am taking risk by predicting CD leg which may or may not seem right to people)
IOC made bullish divergence on MACD histogram on weekly chartIndian Oil Corporation has given bullish divergence on weekly chart. The depth of histogram (bearish zone) is shallow via a vis previous bottom in price which made earlier.
Average Direction index just moved upward (>20) in weekly chart....Further, on weekly chart stock has taken support between 122-125 in last 3 occasion.
IT seems overall bullish pattern is formed for stock.
IOC Inside Bar TradeLong if it breaks the high of the previous day with a stop loss at the previous day's low.
Short if it breaks the low of the previous day with a stop loss at the previous day's high.
In case of gap up above the previous day's high or gap down below the previous day's low, please avoid buying it or selling it respectively. Follow the ending of the candle formed in first 5 minutes and follow ORB strategy.


