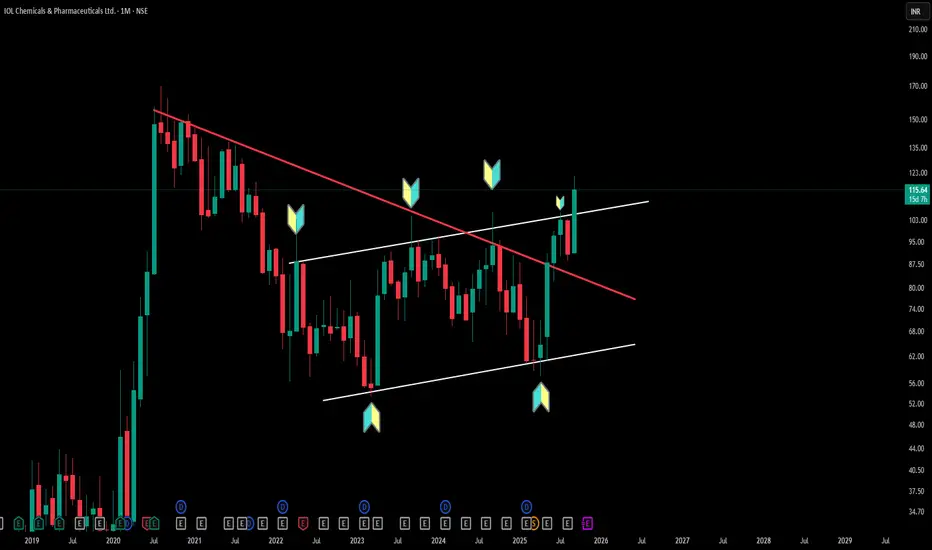
Multi-Pattern Insights: Triangle & Channel Structures (Timeframe: Monthly)
IOLCP's monthly chart perfectly demonstrates how triangle patterns (converging trendlines creating compression) can coexist with parallel channel patterns (equidistant support/resistance lines). Triangle formations indicate price consolidation with diminishing volatility, while parallel channels show consistent bounce zones between defined boundaries.
This multi-timeframe view reveals how experienced chartists identify multiple technical structures within a single timeframe—enhancing pattern recognition skills. Understanding these foundational concepts helps distinguish between different consolidation types and their structural characteristics.
Disclaimer: This analysis is for educational purposes only and does not constitute investment advice. Always conduct your own research before making any trading decisions.
IOLCP trade ideas
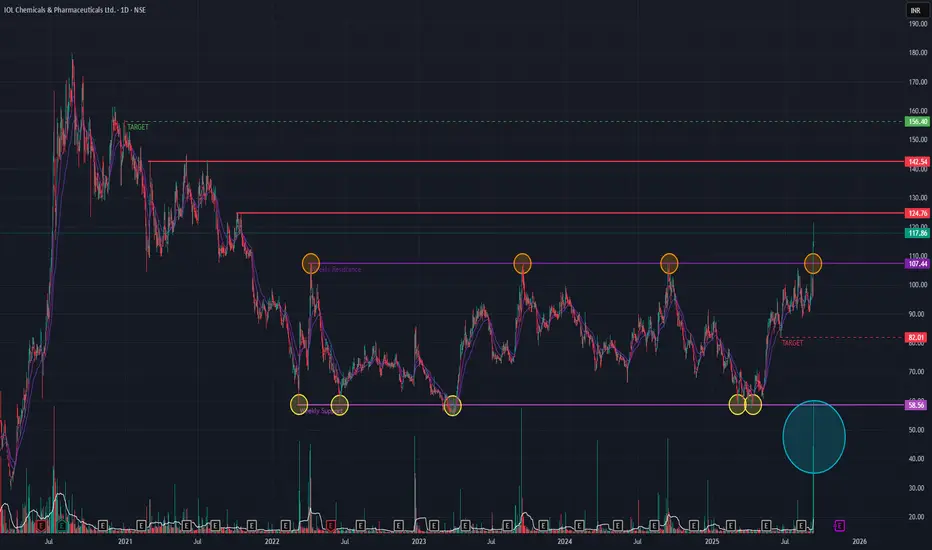
IOL CP (Daily Timeframe) - Has the Sideways Trend BrokenOut ??IOL CP in the past two sessions have BrokenOut of the sideways trend that it was in since Mar 2022. Several attempts in the past to BreakOut of this trend has failed as indicated. The past two days, the stock was able to BreakOut as well as maintain it with huge volume. Short-term EMAs are in PCO state as well as a Golden Cross-over has formed few days back indicating bullishness.
If upside momentum continues then we may see 156 levels provided few resistances are breached. The stock may see 82 levels if the momentum is not sustained.
Keep monitoring the price-action !!
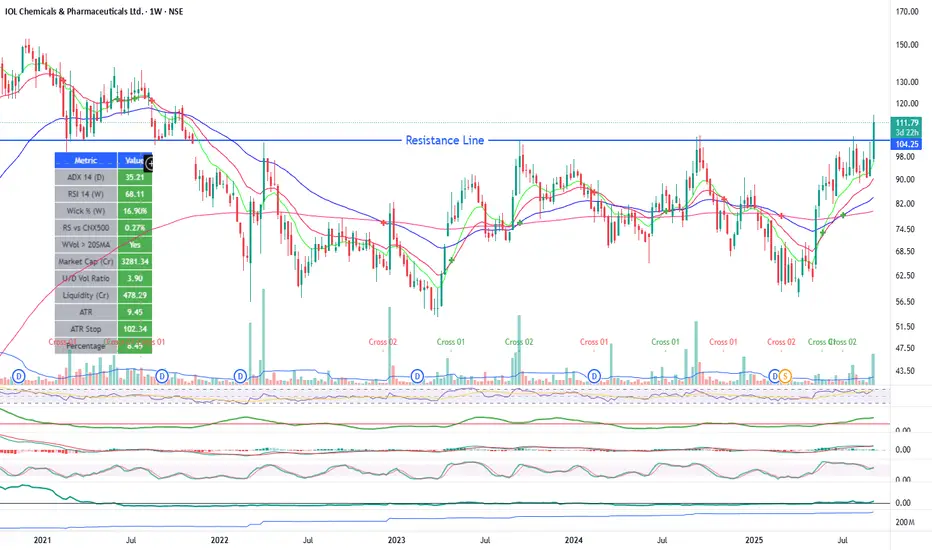
Ye Chart Kuch Kehta Hai - IOL LimitedBased on the weekly chart technical and fundamental outlook of IOL Limited (IOL Chemicals and Pharmaceuticals Ltd), here is the rationale why this stock is likely to grow over the next 2 to 3 months:
Technical Analysis
The weekly chart shows strong bullish signals with all key moving averages from 5-day to 200-day (SMA and EMA) indicating a bullish trend.
Multiple momentum indicators such as RSI, MACD, Stochastic RSI, and ADX are pointing towards bullish momentum, suggesting continued upward price movement.
The recent price performance has shown a positive weekly gain, confirming strength in the short to medium term.
Fundamental and Growth Outlook
IOL Limited is forecasted to grow earnings at approximately 26% per annum and revenue at around 11% annually, which indicates strong fundamental growth potential.
The company maintains a healthy market cap (₹3,325 Cr) with a reasonable P/E ratio (~27) for growth stocks in its sector.
ROCE (Return on Capital Employed) and other financial metrics indicate improving operational efficiency.
The strategic focus on specialty chemicals and pharmaceuticals positions the company well for long-term growth in a high-demand sector.
Risk Mitigation and Timing
Given the technical momentum and strong earnings growth prospects, coupled with a well-defined sector tailwind, the stock is favorably positioned for growth over the next 2-3 months.
The relatively low volatility as indicated by ATR and positive accumulation/distribution trends support a stable upward movement.
In summary, the combination of bullish weekly chart patterns aligned with robust earnings growth forecasts and solid fundamentals offers a strong rationale for the stock's potential appreciation in the near term (2 to 3 months)
Finally the breakout is done or has it not?Stock has been in long consolidation phase with ibu and para prices making lower lows since over stocking post covid. With the new initiative taken by management and prudent cash allocation from covid times, the volumes speak of more than what the PAT showcases.
Technically on weekly charts on the first day of the week, a good volume is seen. Close at 20% would be essential for the continuous up move.
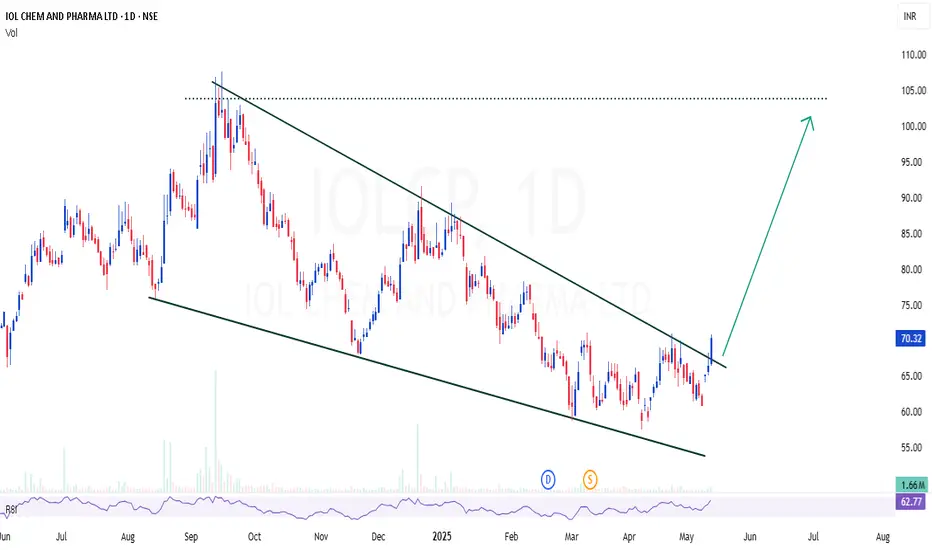
IOLCP | Perfect channel / wedge breakout - Looks good for 50%IOLCP | Perfect channel / wedge breakout - Looks good for 50%
CMP : 70
SL : 60
Target : 100
IOLCP: The Next Big MoveFollowing a prolonged 4 month downtrend, IOLCP has successfully breached the significant resistance level at 417 on daily chart, which now serves as a change of character. The RSI has also crossed above the 60 threshold, further supporting the idea of positive momentum within the stock. Additionally, the daily closing prices are positioned above all EMAs, indicating a strong bullish sentiment.
At this juncture, IOLCP appears poised for upward movement, with the next resistance level identified at 514 . Refer to the accompanying chart for a visual representation of Resistance, Breakout and Stop-Loss.
Disclaimer: This analysis is provided solely for informational and educational purposes and should not be interpreted as financial advice. It is essential to conduct your own research and consult with a qualified financial advisor before making any investment decisions.

IOLCP - Accumulation phase is about to complete IOL CP has a good structure amongst the Chemical Stocks.
CMP - 437
TARGET 1 - 540
TARGET 2 - 690
SL DCB - 390

will give move intradaywill move intraday as the stock is moving from demand zone and higher tf looks good

IOL CL - BullishStock is making lower lows and rejecting from same level indicating bulls accumulating at higher levels breaching that same stock shall provide short term gains.


IOLCP looking good for longIOLCP looking good for long, looking on the trend it was making lower lows then then starting march 2023 making higher high / higher lows which confirms the change in trend. Now it made a double top at 535, crossing this level will fuel it for more levels monthly till 898.

IOLCP ( IOL CHEM AND PHARMA)Hi guys,
I hope you all are enjoying my charts and levels.
The stocks is trading at 508 and seems like going for a breakout with good volume
IN RANGE 480- 506
SL 425 WCB
TARGET 10% + ABOVE WILL UPDATE

IOLCP - Ready for Stage 2 Breakout🔊 IOLCP - Ready for Stage 2 Breakout
IOLCP - IOL CHEM AND PHARMA LTD
⌛Duration - Short Term (3 month to 6 month)
📊📈 Trade Logic - Ready for Stage 2 Breakout
CMP - ₹516.25
Time Frame - Weekly
🎯Target 1 : ₹630
🎯Target 2 : ₹705
🎯Target 3 : ₹855
🛑 Stop : ₹430
🏆 Risk/Reward Ratio (1: 3)
Disclaimer: The stock information shared above is not a recommendation to buy, sell, or hold. It reflects my own analysis and is intended solely for educational purposes. Any actions you take based on this information are your responsibility, and the admin of this channel is not liable for any financial gains or losses. Please consult a financial advisor before making any investment decisions. I am not a SEBI-registered advisor.

IOL Chemicals and Pharmaceuticals LtdDate 12.09.2024
IOL Chemicals and Pharmaceuticals
Sector : Pharmaceuticals & Drugs
Timeframe : Weekly
Remarks :
Stock has reached at major confluence at Gann 4/1 & major support & resistance.
Trade & build long position carefully & having a right kind of quantity.
Once it exits both Gann + major s/r area then can expect good upside momentum.
Some points needs to be understand since it in news & most of people blindly follow news:
1 FII holding only 1.39% & DII holding only 0.09% - Poor
2 EPS (yoy) growth was -3.26 % which is bad for the company
3 Operating profit margin 10.86 % which is a bad sign for profitability
4 Have have a poor return on equity of 8.69 %
5 Falling sales & profit growth
Regards,
Ankur

swing stock IOLCPIOL Chemicals & Pharmaceuticals Ltd is a leading pharmaceutical (APIs) company and is a significant player in the specialty chemicals space. It serves the domestic and export market.
It is the largest player of Ibuprofen (pain killer) globally with a world market share of 35%

IOLCP - 80% upside potential!Price Analysis & Overview:
1. Good Volumes
2. Change in price structure denoting reversal.
3. Strong candle formations.
4. RRR is favourable.
5. Earnings look weak!
Trade Plan:
Entry= CMP
SL= 10-15%
TP= 1:3,1:4,1:5
- Stay tuned for further insights and updates, and trade safely!
- If you liked the analysis, don't forget to leave a comment and boost the post. Happy trading!
Disclaimer: This is NOT a buy/sell recommendation. This post is meant for learning purposes only. Views are personal. I share whatever I do. Please, do your due diligence before investing.
Thanks & Regards,
Anubrata Ray

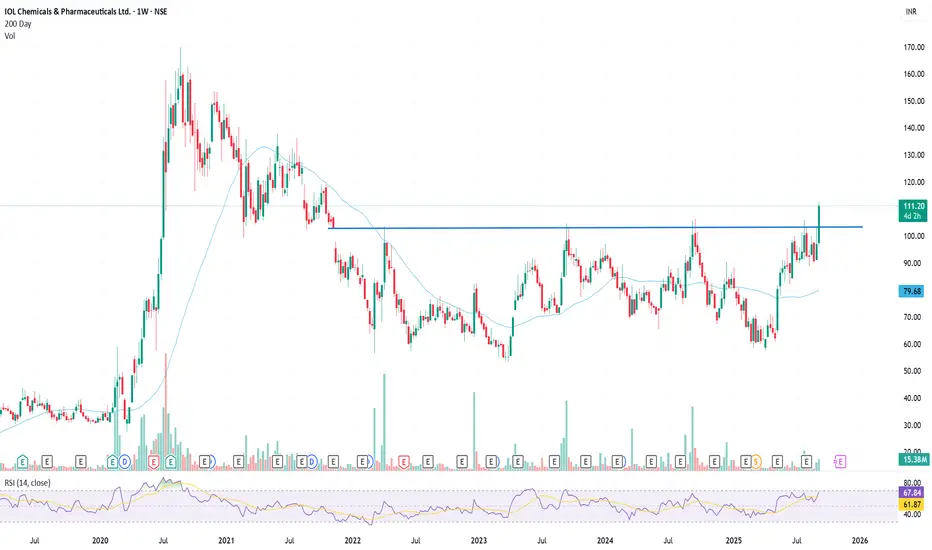
IOLCP - Weekly AnalysisIn the Weekly Chart of IOLCP ,
we can see that, it has trendline breakout.
Let it retest and then enter with SL and Targets.
Expected momentum is shown in chart.

Investment Bet - IOLCPAfter long wait this stock has given breakout. This one stock is from chemical & pharma industry, booming in current market.
Pros
Good Breakout on weekly and daily tf
Upside of 40-50% from current level
Good base formation after 2 years of down trend.
Cons
Low Promoter holding and high public holding.

BUY TODAY SELL TOMORROW for 5%DON’T HAVE TIME TO MANAGE YOUR TRADES?
- Take BTST trades at 3:25 pm every day
- Try to exit by taking 4-7% profit of each trade
- SL can also be maintained as closing below the low of the breakout candle
Now, why do I prefer BTST over swing trades? The primary reason is that I have observed that 90% of the stocks give most of the movement in just 1-2 days and the rest of the time they either consolidate or fall
Cup and Handle Breakout in RANEHOLDIN
BUY TODAY SELL TOMORROW for 5%

IOLCP CMP 462Bought some IOLCP at CMP 462
Expecting good up movement in this stock from here
Risk reward is not in favour for short term to medium term
Best price to buy is near 400 to 410
With a SL of 380
Can try BTST at CMP
Just a view , Not a recommendation.

IOL Chemicals - Best Above - 456IOL Chemicals - Chart is Self explanatory.
Best above 456.
Disclaimer : Please do your own research.

Bullish: IOLCPThe stock is tightly holding the support level of 400
Can enter for a short term target of 440 - 480 levels
Fundamental are not that much great.
But recent momentum is because of good some news.

IOLCP | Looks good for a big reversal - Potential for doublingIOLCP | Looks good for a big reversal - Potential for doubling
CMP : 380 (Dip : 350)
SL : 290
Target : 830
