IPCALAB 1 Hour View📊 1-Hour Timeframe: Support & Resistance Levels
Based on recent intraday data, here are the key support and resistance levels for IPCA Laboratories Ltd. on the 1-hour timeframe:
🔽 Support Levels:
S1: ₹1,324.36
S2: ₹1,323.13
S3: ₹1,322.06
🔼 Resistance Levels:
R1: ₹1,326.66
R2: ₹1,327.73
R3: ₹1,328.96
These levels are derived from standard pivot point calculations and are widely used by traders to identify potential reversal points.
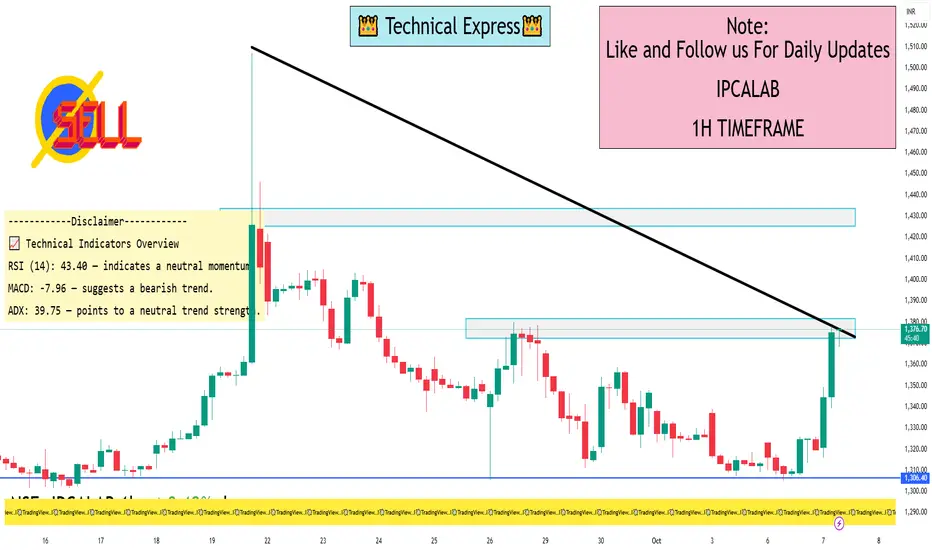
📈 Technical Indicators Overview
RSI (14): 43.40 — indicates a neutral momentum.
MACD: -7.96 — suggests a bearish trend.
ADX: 39.75 — points to a neutral trend strength.
Moving Averages:
5-period EMA: ₹1,325.64 — indicates a buy signal.
50-period EMA: ₹1,352.22 — suggests a sell signal.
200-period EMA: ₹1,351.26 — indicates a sell signal.
Pivot Points:
Pivot: ₹1,325.43
R1: ₹1,326.66
S1: ₹1,324.36
These indicators collectively suggest a cautious outlook for short-term traders, with a prevailing bearish sentiment.
IPCALAB trade ideas
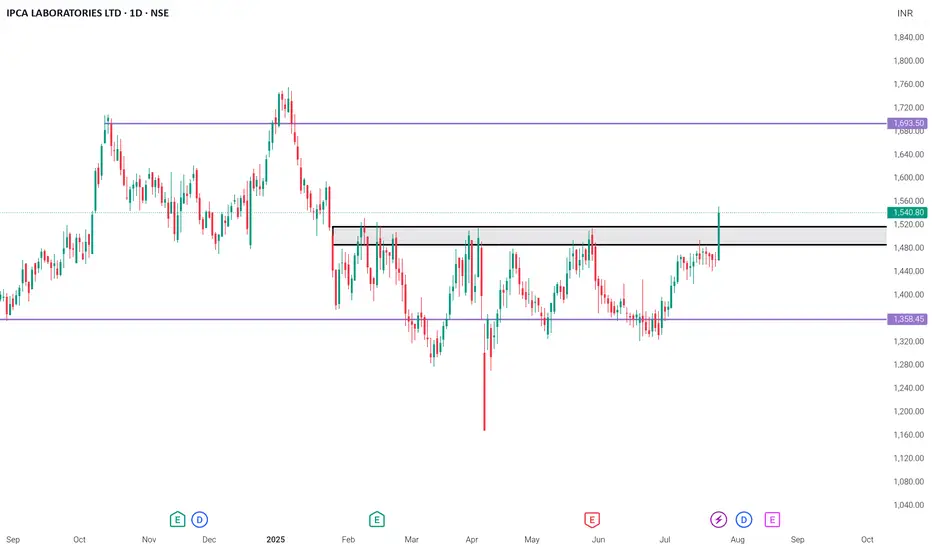
IPCA Laboratories Ltd — Breakout Alert✅ Price broke out of a strong multi-month consolidation range with volume
✅ Bullish momentum surge — confirmation of trend shift
✅ Previous resistance (₹1,520) now turns into support
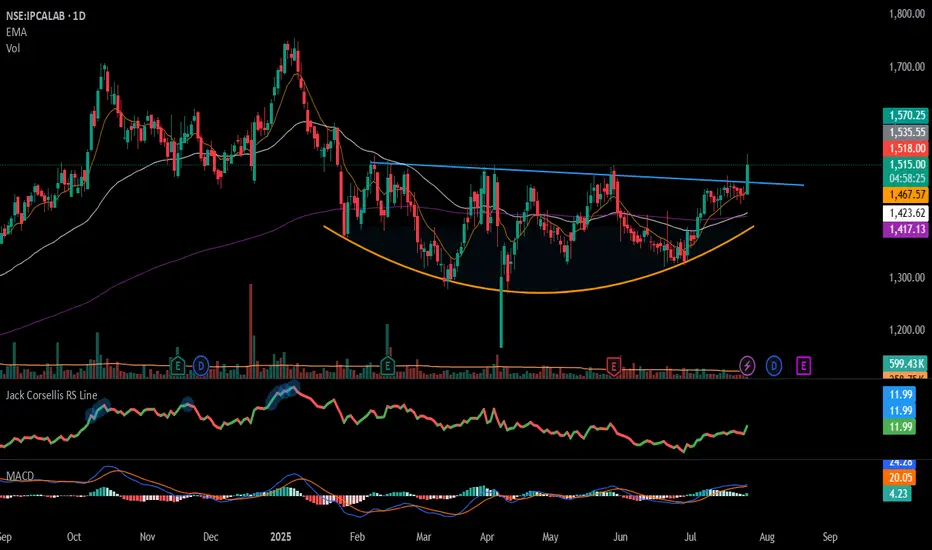
#IPCALAB - Rounding Bottom Breakout in DTF/ Keep in WL📊 Script: IPCALAB
Key highlights: 💡⚡
📈 Rounding Bottom Formation in Daily Time Frame
📈 Price consolidating near Resistance, then Breakout
📈 Volume spike during Breakout
📈 MACD Bounce
📈 Can go for a swing trade
BUY ONLY ABOVE 1535 DCB
⏱️ C.M.P 📑💰- 1514
🟢 Target 🎯🏆 – 12%
⚠️ Stoploss ☠️🚫 – 6%
⚠️ Important: Market conditions are Okish, Position size 50% per Trade. Protect Capital Always
⚠️ Important: Always Exit the trade before any Event.
⚠️ Important: Always maintain your Risk:Reward Ratio as 1:2, with this RR, you only need a 33% win rate to Breakeven.
✅Like and follow to never miss a new idea!✅
Disclaimer: I am not SEBI Registered Advisor. My posts are purely for training and educational purposes.
Eat🍜 Sleep😴 TradingView📈 Repeat 🔁
Happy learning with MMT. Cheers!🥂
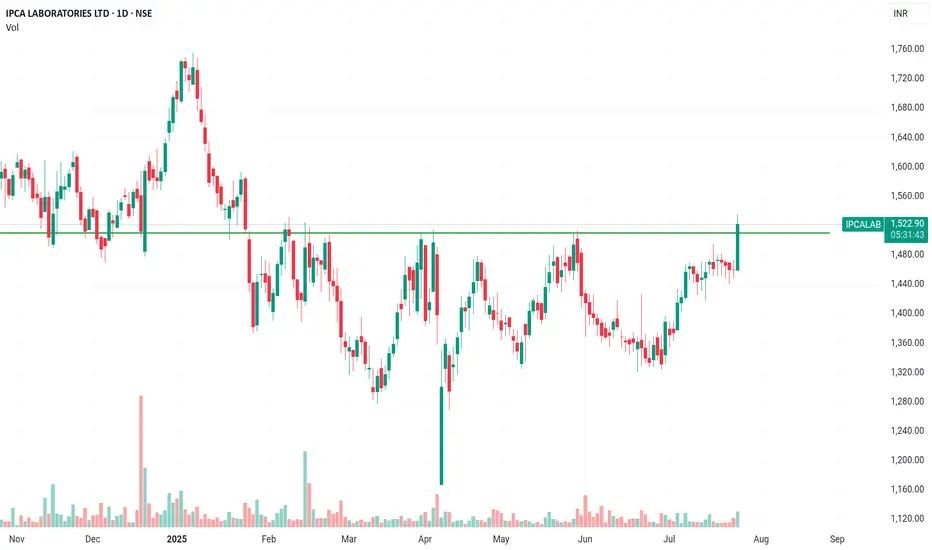
IPCA LABThere is clear cut breakout happening today in IPCA LAB after long consolidation. It looks good for short term as well as long term perspective. Stop loss must be kept below 1440 on closing basis.
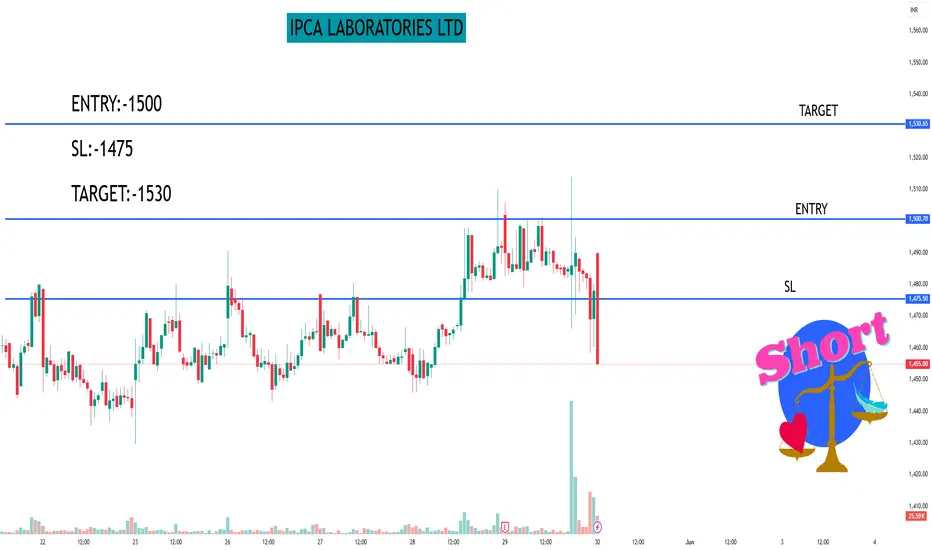
IPCA LABORATORIES LTD#IPCALAB
Intraday stock for 30/05/2025
BUY
ENTRY:-1500
SL:-1475
TARGET:-1530
Disclaimer:-All views are my personal and only for educational purpose.
IPCA LABORATORIES - RETEST OF SUPPORT BREAKDOWNSymbol - IPCALAB
Ipca Laboratories has recently experienced notable price movements, trading near resistance levels after a good pullback from lower levels. Currently, the stock is trading near major resistance zone, which follows a period of strong recovery from its earlier lows. However, the trend appears bearish, and the sentiment is negative. This increases the likelihood of a sell-off from the ₹1500-₹1540 resistance zone, where the stock may face significant selling pressure.
Despite the recent price recovery, the stock is encountering selling pressure near these resistance levels, reflecting a similar trend seen in many healthcare stocks due to changing investor sentiments. As with other pharmaceutical companies, the stock could face volatility due to external factors such as regulatory updates, changes in pricing strategies, or new competition in the market.
Despite short-term fluctuations, the stock remains resilient due to strong fundamentals and an ongoing focus on key therapeutic segments. However, the short-term outlook might face a correction. This could trigger a move towards lower levels, but long-term growth remains intact based on strong earnings prospects and solid market positioning.
Key Resistance levels: ₹1500, ₹1540, ₹1548
Key Support levels: ₹1460, ₹1434, ₹1400
There are no signs of a significant trend reversal, and growth could resume from lower levels should the stock maintain its strong performance fundamentals.
Disclaimer - Do not consider this as a buy/sell recommendation. I'm sharing my analysis & my trading position. You can track it for educational purposes. Thanks!

The trend is strongIPCA CMP 1470
Elliott- thats an expanded flat corrective pattern on the right. The C wave is 1.618 of A. Hence to me the correction is over.
Fibs- the correction has halted at 50% from a higher swing. This is strength.
RSI- the oscillator has halted above the bull zone. Hence the trend is intact.
Conclusion - to me this is still a very good buy as the trend is intact and strong. The Pharma sector is yet another sector that should outperform the Nifty.

30th december ipca labs for intra cum swingipca labs has shown breakout on daily trendline
buy in zone 1638-1648
stoploss will be 1615
target will be 1670-1700-1720 ++
breakout is solid so you can add on dips to , it will rock in 2 to 4 days or today itself

PCA Laboratories LtdThe chart for IPCA Laboratories Ltd. (NSE) displays a potential flag pattern breakout, suggesting bullish momentum continuation. The price has broken out above the consolidation range, supported by a prior strong rally (flagpole) and notable volume activity. The RSI is near 62, indicating bullish momentum while leaving room for further upside before reaching overbought levels. The MACD shows a bullish crossover, with the MACD line above the signal line and a growing positive histogram, reinforcing the bullish outlook.
Key support levels are observed at ₹1,550 (lower trendline of the flag), ₹1,400, and ₹1,200, providing strong downside protection. Resistance levels to monitor include ₹1,700 (immediate), ₹1,850, and ₹2,000 (long-term target). Traders can consider entering around ₹1,650, ensuring the breakout sustains, with a stop-loss at ₹1,550 to manage risk. The targets for this trade are ₹1,700 (short-term), ₹1,850, and ₹2,000 (long-term, based on the flagpole projection).
While the breakout setup appears favorable, traders should remain cautious, especially if the price approaches overbought RSI levels, as a short-term consolidation or pullback could occur. A sustained close above ₹1,700 with strong volume will confirm the continuation of bullish momentum toward higher targets.

IPCA Lab Short IntradayIPCA is weak with volume. On critical price junction. We will wait for breakout for intraday shorts.
Trade Signal is 1503.4. Stock has taken support at this exact level multiple time.
Once break 1500 stock is weak and short trade get confirmation. We can keep target 1585-80
Once stock goes to 1590 we move our SL to 1501.
All levels are mentioned in stock.

IPCA LABS - Shorts below 1550 you may think of buying a put option or selling futures if IPCA labs closes below 1550 levels and then you can thank me later by boosting, liking and sharing the post.
One of the first modern pharma factory of yesteryears was commissioned by Ipca at Mumbai in 1969. The company was originally promoted by a group of medical professionals and businessmen and was incorporated as 'The Indian Pharmaceutical Combine Association Limited. ' in October 1949.
Thank you.

IPCALAB 1HRSWING TRADE
- EARN WITH ME DAILY 10K-20K –
IPCALAB Looking good for Downside..
When it break level 1558 and sustain.. it will go Downside...
SELL @ 1558
Target
1st 1548
2nd 1535
FNO
IPCALAB NOV FUT – LOT 6 (Qty-3900)
IPCALAB NOV 6200 PE – LOT 6 (Qty-3900) – PRICE (70.40)
Enjoy trading traders.. Keep add this STOCK in your watch list..
Big Investor are welcome..
Like this Post??? Hit like button..!!!
Follow me for FREE Educational Post and Alert..

IPCALAPEntry @1655 Above Close or retest range
Hold 1 month
Target 10% and 20%
SL day candle close only, Target Trigger Price
All detail for chat. good entry at mark price only. and must stoploss minimum risk and good profit. risk ratio 1:1 to manage modified SL. This is not call, Just my idea. Please understand your risk and take full responsibility of your actions

IPCA Lab - Observing Buy SetupCMP 1361 on 09.08.24
The above weekly chart shows that the price has formed a cup & handle pattern in the last 2 years. If this pattern continues we can expect a breakout on the charts.
MACD is showing a likely crossover too.
Possible targets may be 1600/1800 or even more.
As long as it sustains above 1300, this setup remains relevant.
Decide your exit levels according to your position sizing and risk-management.
This illustration is only for learning and sharing purposes, not a piece of trading advice in any form.
All the best.

IPCALAB: Multi-Year Breakout: Monthly Timeframe: Oct'24IPCALAB: Multi-Year Breakout: Monthly Timeframe: Oct'24
Stock comfortably broke the high (1383.1) it made in Sep'21 and closed above in Sep'24. A multi-year breakout on a monthly time frame
RSI in Sep'24 (63.27) is above 60.
Breakout in Sep did not happen with above average trade volume (9 SMA)
Drawdown = 713.3/-
Target = Breakout level + Drawdown during consolidation phase = 1383.1 + 713.3 ~ 2090
ATR = 136.47
SuperTrend = 1020.92
Stop Loss = 1 ATR below previous month's low = 1375 - 136.47 ~ 1235

IPCALAB
In our previous update in July 2023, we mentioned that stock’s corrective phase could be over, and it is a Value Buy.
Price has now cleared its previous all time high of 1383.
This suggests continuation of long term up-move.
Price is now initially expected to test 2535, with optimistic targets extending to 3700 and 5555.
Bullish outlook remains intact as long as price is above 1350.

Ipca Laboratories Ltd.Ipca Laboratories Ltd. engages in the manufacturing, marketing, research, and development of pharmaceutical products.

IPCA- LONG FOR 20%Price bouncing from 50 week EMA and crossing 18 week EMA while 18>50>100>200 week EMA is intact
price forming an inverted H&S pattern on weekly frame
though valuation is expensive , 20 % move is expected
target and SL marked

IPCALAB -- Cup and Handle -Breakout-WklyIPCALAB -- Cup and Handle -Breakout-Wkly
Name - IPCALAB
Pattern - Cup and Handle
Timeframe - Wkly
Status - Breakout
Volume - Avg
Cmp - 1399
Target - 2060
SL - 1350

IPCALAB - CUP AND HANDLE PATTERN WEEKLY CHARTThe stock has formed CUP & HANDLE pattern
on the WEEKLY chart.
One can enter above 1383 or Wait for weekly candle close above 1383 with a strict Stoploss of 1240
Target 1 - 1650
Target 2 - 1820
Target 3 - 2000
#LONGTERM TRADE
What is your view please comment it down and also boost the idea this help to motivate us. All views shared on this channel are my personal opinion and is shared for educational purpose and should not be considered advise of any nature.

IPCA LABS MAKING OUTSTANDING CUP AND HANDLE PATTERNThe stock has been forming an cup and handle pattern on the daily timeframe lately it can give breakout anytime soon and looking from a long term perspective the stock can shot up to 2000 levels (6-8) months
1274 will act as a crucial support in any case of potential downside .
The PE of the stock is around
60 which is quite concerning and indicates a pretty high valuation however the technicals seems alright and quite optimistic
The cup had taken around 3 years in formation which indicates a very mamoth consolidation from 2021-24 and a short handle which got initated in the month of may and is now is in ts's final stages
Piotroski score
7.00
ROCE
12.8 %
ROE
9.35 %
Stock P/E
61.6

CUP AND HANDLE PATTERNThe above weekly chart shows that the price has formed a cup & handle pattern in the last 2 years. If this pattern continues we can expect a breakout on the charts.
MACD is showing a likely crossover too. Possible targets may be 1600/1800 or even more.
As long as it sustains above 1300, this setup remains relevant.
Decide your exit levels according to your position sizing and risk-management. This illustration is only for learning and
sharing purposes, not a piece of trading
advice in any form.
All the best.

IPCA laboratories standing at resistanceHello👋
Today one more stock for study.. Which is about to break the resistance.
It's IPCA LABORATORIES.
Stock has made good pattern on weekly chart. It's cup & handle.
It's previous high was 1373..if stock crossed.. Can be good move to upside..
Rsi also in bullish zone.. Price is making HH & LL.
All parameters are positive. Good qty holding in FII & DII.
It's my view. Plz DYOA. No buy or sell recommendation🙏
Thank you.
