IRCON INTERNATIONALBUY @ 187.10 RS
TARGET @ 227.80 RS
BUYING CONFIRMATIONS : Darvas box breakout
Expected returns are around 21.00 %
IRCON trade ideas

Buy ircon--darvas box breakout and retest
--uptrend
--budget stock
--Railway sector in focus
--Breakout volume is good
--Target 220+ for short term
Disclaimer:
- The view expressed here is my personal view
- Any decision you take, you need to take responsibility for the same
- It's your hard earned money. Treat it wisely
- Trade / Invest keeping in mind your trading style, goals and objectives, time horizon & risk tolerance
-- Do your own analysis and consult your financial adviser if needed

IRCON - Long Setup, Move is ON..NSE:IRCON
#IRCON trading above Resistance of 189
✅ Next Resistance is at 250
Related charts:
Charts are self-explanatory. Levels of breakout, possible up-moves (where stock may find resistances) and support (close below which, setup will be invalidated) are clearly defined.
Disclaimer: This is for demonstration and educational purpose only. This is not buying or selling recommendations. I am not SEBI registered. Please consult your financial advisor before taking any trade.

Ircon International Ltd - Long Setup, Move is ON...#IRCON trading above Resistance of 140
Next Resistance is at 185
Support is at 109
Here are previous charts:
Chart is self explanatory. Entry, Resistances and Support are mentioned on the chart.
Disclaimer: This is for demonstration and educational purpose only. This is not buying or selling recommendations. I am not SEBI registered. Please consult your financial advisor before taking any trade.

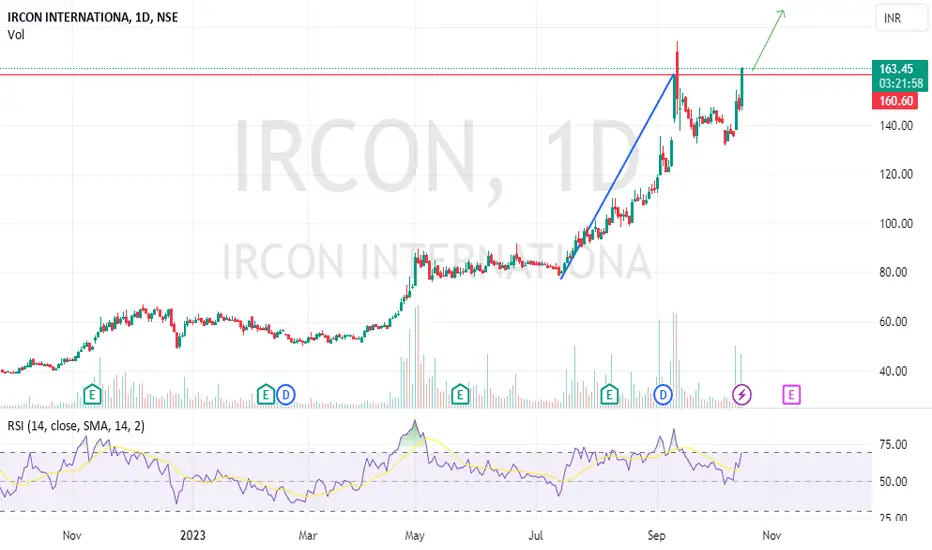
IRCON -Retest done- Ready to Rally 🚂🚋🚃🚋🚃🚋🚃IRCON
-CMP 192.85
-Huge Volume buildup near breakout zone
-Retest also done after the Ascending Triangle #Breakout
-Ascending MonthlyCPR
-Price is above all major SMAs
-Suppt 170

IRCON LONG TERMAny one who interested in adding railway stock can go with this share as because its weekly chart is looking good and breaking out and also previously when railway stocks were making new high compare from other stock or railway sector pe this share share has lowest pe so now its time to invest in this company and make your porfolio green and healthy because you come to market to make profit not loss so make it bigger with this stock when any deep comes you can add this stock not purchase this share at the first tick so decide according to it ..
DISCALIMER:- i am not sebi registered and all profit and loss as well is yours i am not responsible for it in any ways. consult your financial advisor before taking entry into me below mention share previously and upwarding also so decide according to your choices and i am not responsible
thanks if you think i am doing good work then you can follow me
feel free to comment if profit generate and loss as well

Significant Breakout in IRCON📈 🚀 📈 #IRCON just experienced a significant breakout today, opening doors to potential upward price movement. Big opportunities ahead! Keep a close eye on this one. 🚀
CMP : 187
Strong Support : 180-175

IRCON is about to fly ✈️IRCON is about fly
-CMP - 187
-Ascending Triangle breakout
-VCP pattern
- Monthly narrow CPR
-Volume Spike
-Monthly Resistance broken
- good fundamental stock
- Strong Support 170
- Target 220| 260|300|More
#IRCON #NIFTY #GOLD #Crypto #Bullish #bitcoin #Crude

IRCON BREAKING RESISTANCE TRENDLINEIRCON is breaking #resistance trendline
with good volume and rsi
macd crossover done
EDUCATIONAL IDEA

IRCON BO [DAILY]IRCON BO today, last few days, it has filled a gap down with volumes -> Positive sign
Breaking out of a decent base for 2nd time, 1st time BO can be said was kind of a shakeout, so now hands have changed and this BO may be more healthy as its a new attempt.
Keep in list for the week.

📈 **$IRCON Bulletin: Short-Term Alert! 🚀**🕯️ DOJI Setup Unveiled: Identify the characteristic DOJI pattern on the charts.
🔄 9 and 20 EMA Retest Completed: Confirm the retest of the 9 and 20 EMAs for added reliability.
🎯 Short-Term Long Position Opportunity: Position for potential gains in the short term.
🛑 Stop Loss: DOJI Candle's Low: Implement risk management with a stop loss at the low of the DOJI candle.
📈 Entry Trigger: Above DOJI Candle: Optimize your entry strategy by entering above the DOJI candle.
Unlock the potential and ride the wave with $IRCON! 🌊💹
Guidelines:
🧐 Conduct Further Analysis: Supplement this bulletin with your own analysis for a comprehensive view.
📉 Monitor Price Action: Keep a close eye on price movements to confirm the setup.
🚨 Adapt to Market Conditions: Be flexible in your approach and adapt to evolving market dynamics.

IRCON: Positive sustainable run upIntroduction:
NSE:IRCON , a leading construction and infrastructure company, is currently trading on the National Stock Exchange (NSE) at INR 58.55 . This technical analysis examines the stock's recent price action and provides a trading recommendation based on key technical indicators.
Technical Analysis:
IRCON is trading near the crucial Fibonacci level of 0.618 , attempting to break upwards. A bullish crossover has been observed in its Exponential Moving Average (EMA) and Moving Average (MA) indicators , suggesting a potential uptrend in the short term.
Additionally, the Parabolic Stop and Reverse (SAR) indicator is also favoring the bulls, which could signify a continuation of the positive price momentum.
Trading Recommendation:
Based on the above technical analysis, we recommend the following trade:
Entry: Buy IRCON at or above INR 58.55 (current market price)
Target 1: INR 61.30
Target 2: INR 64.20
Stop Loss: INR 55.50
Please monitor the stock for a breach of the Fibonacci level upwards before initiating a long position. The stop-loss order at INR 55.50 aims to protect capital against potential price declines.
Disclaimers and Disclosures:
This analysis is for informational purposes only and should not be construed as investment advice or a recommendation to buy or sell any security. The author is a not a technical analyst and not a registered financial advisor. The opinions expressed herein are solely those of the author and do not represent the opinions of the Premium wealth management firm.
Past performance is not indicative of future results. Investing in securities carries risks, including the risk of loss of principal. Investors should conduct their own due diligence and consult with a professional financial advisor before making any investment decisions.
Disclosure: The author may or may not have any positions in the securities mentioned in this analysis at the time of publication.

IRCONvcp characteristics
-The Stock must be in stage 2 uptrend.
-A period of price consolidation must take place in thebase. ...
-Price volatility must contract through the base (from left to right). ...
-Price must correct through a series of smaller contractions.

IRCON: The sector is in focus⚡️ IRCON: 166
HERE WE GO!
One of the most discussed stocks over the weekend 😂
- Standing tall after a massive 96% move
- 2-month consolidation near ATH
- There was a breakout on the 20-day Pocket Pivot volume on 17 Nov
- It has been consolidating since then making narrow candles
There is an opportunity to add above 170 with an SL of <3-4%

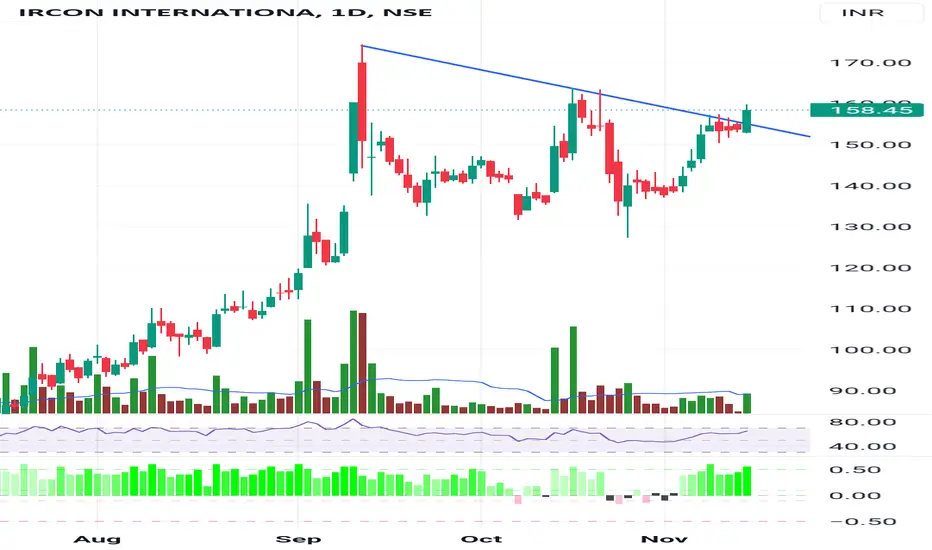
IRCON Shared at 158 made high 172.5 IRCON gave good range breakout and along with it many railway company doing well
So need to track such stock which have good potential
IRCON made high around 172.5 from 158 after trendline cross

IRCON Bullish; above 170 on Monday 20 Nov. The above information does not constitute investment/trading recommendation and it is purely for educational purpose. Please check the Strategy below...
SWING Trading Strategy:
Position is created, only upon stock closing above the entry price on day closing basis and is held on for 5-10 trading sessions for larger gains (5-10%)
INTRADAY Trading Strategy:
1) Impulse upmove stage: The strong upmove (nearly upto 2% from breakoutprice) happens within five to 15 minutes. "High Risk Traders" buys in hope of another 2% upmove intraday.
"High Risk Traders" may have to patiently wait through the Pullback-Consolidation stage to realize profits. High risk/High reward set up as breakouts may fakeout (reversal)also
2) Pullback-Consolidation stage: After the above "Impulse upmove stage"; the price may then pull back and move sideways (between "Open" price and "High" of the above "Impulse upmove stage").
Safe traders with minimum risk profile may Wait for a breakout from the consolidation to enter at this stage to relize high profits in the final intraday final "Breakout continuation" stage
3) Breakout continuation: Stocks often in the third stage breaks up above the "High" of the first "Impulse upmove stage" and continue to go higher again.
Both Safe Traders/High Risk Traders book profits at this stage
Stop Loss: @ "Open" price of the day OR "Breakoutprice"
This do not constitute, financial, investment, trading, or other types of advice or recommendation.

ircon breakoutircon face a tuff resistance on 160 stock bounce on 50ema 3time reject on 160 finally stock give breakout and close above 160 can buy at cmp sl 150 minimum tgt 190/195
pls like and support us
note for educational purpose only

BUY IRCON--Breakout with huge volume
--supporrt 157
--Resistance 170
--Target 200+
--Railways sector looks Bullish
--Shared RVNl study last week
--RSI uptrend
--ADX suggesting long Bull run
Disclaimer:
- The view expressed here is my personal view
- Any decision you take, you need to take responsibility for the same
- It's your hard earned money. Treat it wisely
- Trade / Invest keeping in mind your trading style, goals and objectives, time horizon & risk tolerance
-- Do your own analysis and consult your financial adviser if needed

IRCON - look good at 158 for 174/175Ircon chart is bullish and ready to move towards 174/175 kindly watch closely

IRCONAfter a failed breakout in mid Octo, the stock seems to be attempting to make a re-attempt at moving out from a good constructive base. Let's see whether it can sustain towards close a good high volume close to add further conviction

$IRCON - Weekly Chart AnalysisA new all time high close. Stock was consolidating for a while now and have gave a strong breakout of that consolidation. It's kind a flag pattern breakout too. All the key MA's are rising too. If we draw a trend based fib extension than ideal levels it can test is 100 (~161.8%) and 114-115(200%) is which we get.
An ideal pullback to the breakout levels can be the best entry points with low risks.
Disclaimer: This is just an analysis and should not be considered a buy/sell call. If you intend to trade this counter then please do your own due diligence and trade at your own risk.

Double Top and breakoutDouble top pattern and break of previous high in IRCON.
CMP: 163
Stoploss : 140