IRCTC trade ideas
IRCTCBuy-1830
SL-1725 below Closing Basis
Target-1935-2070
Soon Reopening of Trains Will be announced.
Covid cases Decreasing On Daily Basis.
MArket is always Ahead of Us.
Be Pre-Prepared..


IRCTC Bullish Flag breakoutIRCTC showing a bullish flag in 1 hr chart. Broken out of the channel and took a first retracement. Can look out for another up move.
Disclaimer: Educational purposes only

Indian rail corp ltd cup and handle pattern possible.The stock is in uptrend there can be a possible breakout of this cup and handle and target of 2850 can be achieved as a positional trade which can take some weeks or months.
Good sl can be below 200 ema in daily time frame which is at 1541.

IRCTC Looks weak !!!IRCTC : cmp : 1725.2
Making lower lows for 5 days.
A H &S kind of pattern is forming in D chart and on d verge of BD.
TGT 1685/1661/1622/1598
Sl 1781 clbs
Disclaimer: Ideas for learning Only.
Learn Regularly. Not occasionally.
Keep on radar SBI life and heromoto..idea already shared.

Pvr will come down very soonMonthly and Weekly RSI levels of pvr is weeks and daily rsi chart is trading at resistance level.

IRCTC CHART LOOKS GOOD !!IRCTC is taking support at rising trend line multiple times.
Ascending triangle is clearly visible. This pattern gives smooth move on upside.
Similarly Descending triangle gives smooth move in downside.
Currently IRCTC is moving in narrow range ( marked by dotted line ) either side break.
If it breaks on downside that will mark a lower high and new Lower low will be there, this will make stock bearish .
at each arrow marked low will be the targets.
If it breaks on high side it will touch the upper resistance marked, eventually we can expect a strong move on upside.
My take is as the stock is in continuous uptrend on longer charts. I can take the smaller risk now, or can enter with small quantity ( 1/3 or 1/2 ) depending of the risk appetite.
Stop loss is not even 15 %
Therefore for long term view or positional traders can go long keeping in mind the risk involved
When it crosses range on upside it will move more 60 70 rs away from stop loss, there by increasing the risk.
Plan well and trade accordingly.
Tip: Whenever you see any pattern forming always convert your drawings from candlesticks to line chart. This will give you an edge in the trade.
Not a recommendation, do your analysis & then enter.

Intraday for IRCTCIntraday for IRCTC, candle should closed above or below pink zone. Candles weeks can go out of pink zone on either side but closing is important. after closing wait to give good move.

IRCTC breakout formationAs it is forming ascending triangle pattern it is expected a big move up side.


IRCTC BUY - TRAIN TO 2150 IRCTC
BUY ABOVE 1820
SL -1765
TARGET- 1900 1950 2000 2100 2150
DURATION- 1-2 WEEK
NOTE:- I AM NOT SEBI REGISTERED . ALL THE ABOVE ANALYSIS SHARED IS MY PERSONAL OPINION.


IRCTC Symmetrical Triangle BreakoutIRCTC has given bullish breakout with symmetrical triangle pattern
Major Resistance:1850
Major Support: 1760
Trade with Stoploss!
For Information & Education purpose only!
Regards
Trade Leader

Buy IRCTCBuy IRCTC at 1624 Stoploss 1600 Target 1650 and above
Study: Triangle Breakout and stock retesting Breakout area

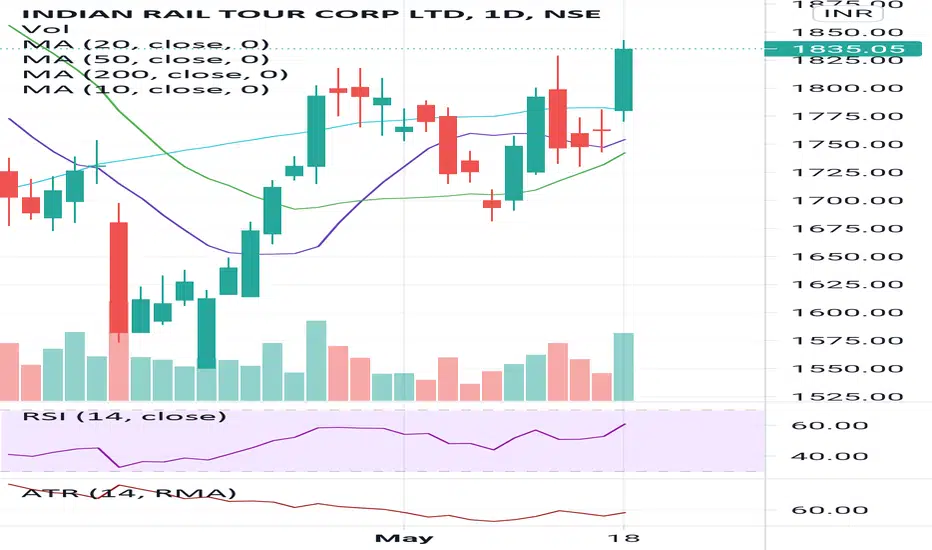
IRCTC LOOKS POSITIVEIRCTC was observed a bullish pattern on a uptrend with strong indication.
IRCTC It created a symmetrical tringle indication of short term breakout.
IRCTC can used for intraday as well.
Targets to be considered are 1872 - 2054.
Let me know if you have any suggestions or recommendations.
Thank you.
Disclaimer :- Just an idea not any recommendation


Question on IRCTC for Short TermQuestion on IRCTC for Short Term
Well between support and Resistance.
Good to buy on dips near support..


