IRCTC trade ideas


IRCTC Trading SetupDisclaimer: All charts are purely for educational and information purpose only. Invest or Trade at your own risk.

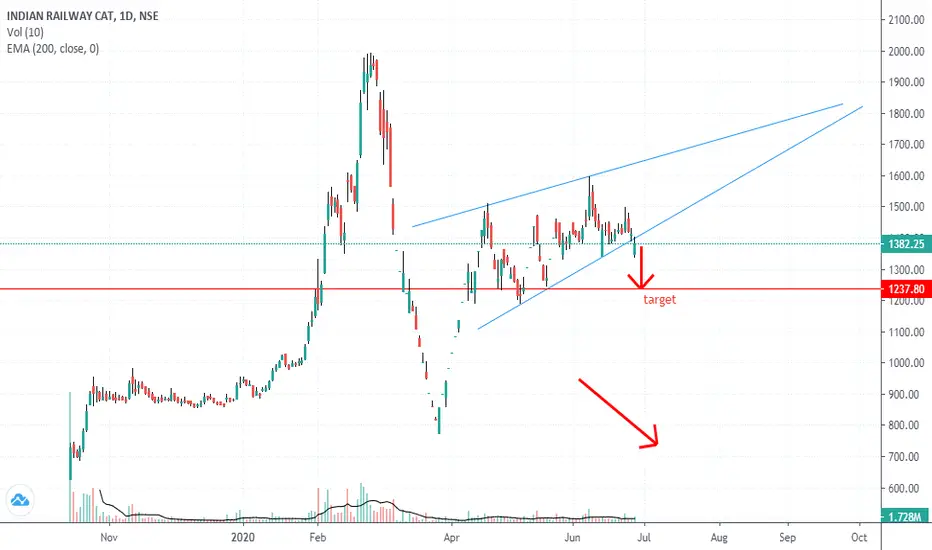
IRCTC SHORT Traingular breakdownTREND ANALYSIS & TRADE SETUP
Follow Chart Instruction.
Do not be Hurry for entry.
Wait for Proper Entry Setup.
Buy/Sell with Best Risk Reward.
Educational Chart Only.

IRCTC Buy IdeaDetails mentioned in Chart
Disclaimer - Please do your own analysis before initiating the trade

Traingular breakdown - Pure price actionPrice action clearly depicts the strong bearish view for short term.
Prior to the failed breakout price action was quite bullish but after the breakout failed the stock has continuously made LH & LL which is a classical bearish price action. RSI confirms the strength of bears and weakness of bulls. Once the RSI falls below 40, one can expect a sharp fall with momentum.
Let's wait for some more price action as it could retrace. Trade with caution.
Disclaimer: Take this view only for educational purpose. Trade on your own risk.
Happy trading!

IRCTC unstoppableIndian Railway Catering Tourism is at crucial support. Results are promising. If sustains above 1450. Targets will be 1500, 1600 1750 within 2-3 weeks. SL at 1350. This is investment stock, any dip is buying opportunity. Hold longer the better!
(Disclaimer: Consult your financial advisor or invest at your own discretion)


Perfect support#Results date published on paper. heavy buying identified btw 1440-1465 during the downtrend.
Expecting good results with continuous upper circuits until 1700-1800+
Also correction is going from long time.
Results might be out by the EOD tom.....

IRCTC Trading SetupDisclaimer: All charts are purely for educational and information purpose only. Invest or Trade at your own risk.


Playing around support. It is likely that the scrip will cross 1401 tomorrow. If it remains bulish for some time, a level of 1680 can be seen in intermediate term.


IRCTC Short !IRCTC looks weak for the short term target, one can bet for target 1200/- as in coming days govt planning to stop train services which can be effect on this stock much more.

IRCTC BearishRising wedge with breakdown and decreasing volumes.
Research purely for Educational purpose
don't miss this opportunity !!possible short idea .. investing in stock market always requires detailed analysis .. do you own analysis and then trade .. since a possibility of a second crash is there due to poor results of Q1 , this short idea is more better ..

IRCTC Trading SetupDisclaimer: All charts are purely for educational and information purpose only. Invest or Trade at your own risk.

Short term target 1610 and long term target 2000IRCTC following parallel channel trend line the short term and long term targets are below
Short term target 1610 and long term target 2000


Buy IRCTC at 1423 . Target - 1611. Stop loss- 1406IRCTC Chart Is Showing a Pattern formation Higher Top Higher Bottom . It was Consolidating for 6 Trading Sessions btw ( 1389-1400).
MACD Crossover & SMII Is Showing Strong Bullish Move From Monday. Stock Is Ready For Its Journey towards 1600 within 7 Days.

Bullish rectangle at IRCTC - Go longBullish rectangle forming after an uptrend ending on 21st April 2020 indicates a probable uptrend when the rectangle is completed.
Rectangle pattern denotes investor confusion regarding price, which corrects itself with a following uptrend or downtrend.
Go long when price falls near 1230. Stop loss at 1195.

IRCTCCurrently IRCTC is in range bound movement. It has broken 20 day simple EMA however volume is not supporting it. Also it breakouts on Doji candle which is indecisive candle hence it is not good to trade in it untill it breaks out on either side with volumes
