IREDA 1 Week Time Frame 📈 1-Week Performance Snapshot
Current Price: ₹153.20
1-Week Change: Approximately +0.07%
1-Month Change: Approximately -1.92%
3-Month Change: Approximately -5.12%
1-Year Change: Approximately -30.65%
📊 Recent Trading Activity
October 20, 2025: Opened at ₹151.54, reached a high of ₹154.98, and
Indian Renewable Energy Development Agency Ltd.
149.50INRD
−0.05−0.03%
At close at Nov 14, 10:50 GMT
INR
No trades
Next report date
≈
January 19
Report period
Q3 2025
EPS estimate
—
Revenue estimate
—
6.30 INR
16.98 B INR
66.60 B INR
793.41 M
About Indian Renewable Energy Development Agency Ltd.
Sector
Industry
CEO
Pradip Kumar Das
Website
Headquarters
New Delhi
Founded
1987
ISIN
INE202E01016
FIGI
BBG00JM8N233
IPO date
Nov 29, 2023
IPO offer price
0.38 USD
Indian Renewable Energy Development Agency Ltd. is a non-banking financial company, which engages in the promotion, development, and extending financial assistance for energy conservation projects. It operates through the Financing Activities in the Renewable Energy and Energy Efficiency Sector and Generation of Power through Solar Plant Operations segments. The company was founded on March 11, 1987 and is headquartered in New Delhi, India.
10.0%
14.5%
19.0%
23.5%
28.0%
Q2 '24
Q3 '24
Q4 '24
Q1 '25
Q2 '25
0.00
5.50 B
11.00 B
16.50 B
22.00 B
Revenue
Net income
Net margin %
Revenue
Op expenses
Op income
Int expenses
Non-op income/expenses
Pretax income
Taxes & Other
Net income
0.00
5.50 B
11.00 B
16.50 B
22.00 B
Revenue
Op expenses
Op income
Expenses & adjustments
Net income
0.00
5.50 B
11.00 B
16.50 B
22.00 B
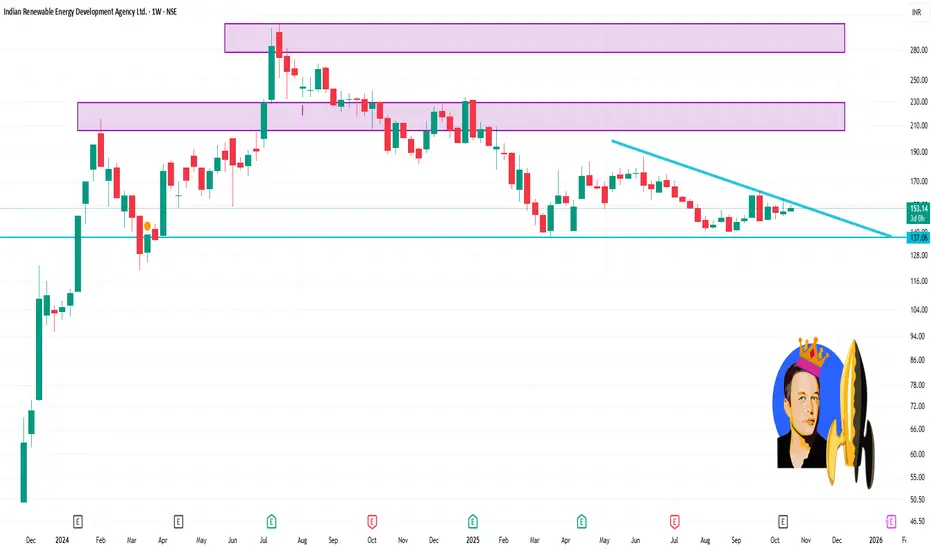
IREDA, Still bearish but consolidation might get over soonIREDA is showing no sign of bullishness but the consolidation seems getting over.
It can be a buy in the range of 140-155 with stop loss of 134 on closing basis (preferably weekly) and 129 on level basis.
Targets can be 180, 220.
RR ratio 1:~3

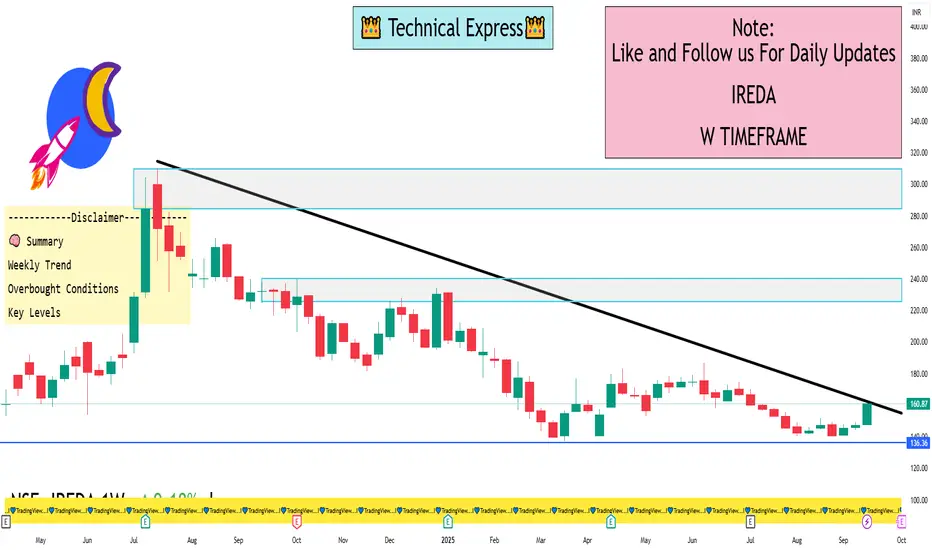
IREDA: Breakouts Test Your PatienceEvery breakout looks easy on the chart — until you’re inside it.
That’s when patience and discipline get tested the most.
🔎 Technical Context
After months of decline, IREDA finally bounced from the ₹135–140 zone.
Strong push took it above the 20 & 50 MAs, with volume support.
Price now meets the

IREDA 1 Week View📈 Current Price & Trend
Latest Price: ₹160.87
Weekly Change: +9.14%
52-Week Range: ₹137.01 – ₹239.90
Market Cap: ₹45,192 Cr
🔍 Technical Indicators (Weekly)
RSI (14): 62.41 — Neutral to Bullish
MACD (12,26): 0.05 — Slight Bullish Crossover
ADX (14): 23.78 — Neutral Trend Strength
Stochastic
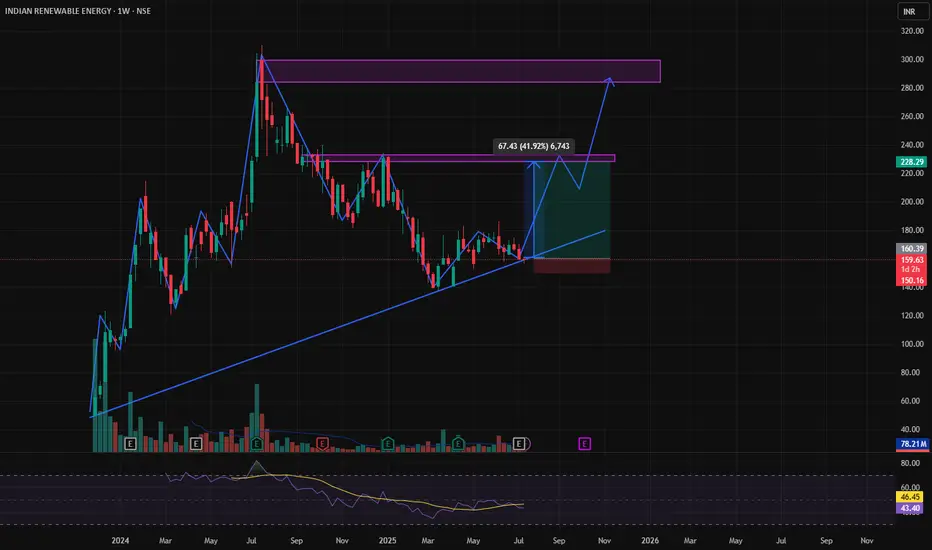
IREDA – Weekly Double Bottom - ReversalDisclaimer: This analysis is for educational purposes only. I am not a SEBI-registered advisor. Please consult your financial advisor before making investment decisions.
IREDA – Weekly Double Bottom - Reversal
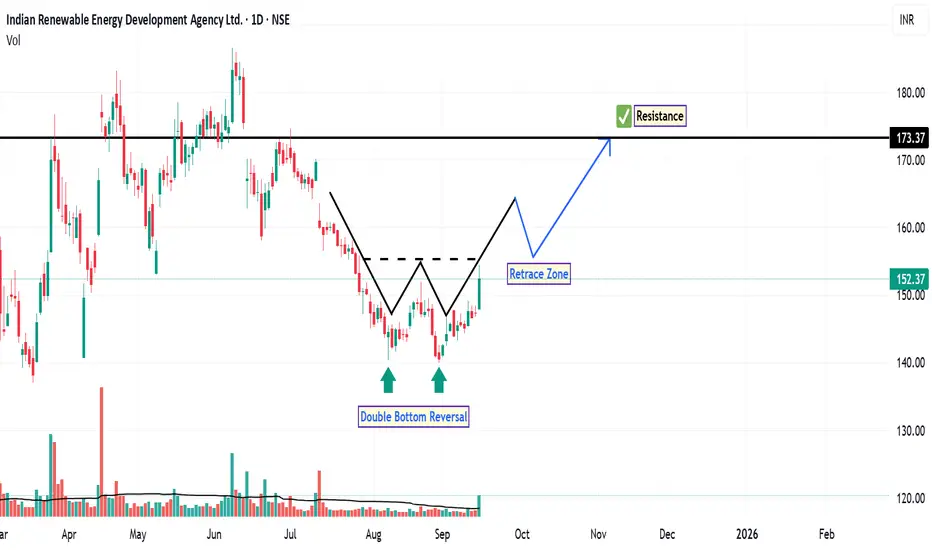
🎯 Targets
Target 1: ₹183
Target 2: ₹232
Target 3: ₹309
⚖️ Risk-Reward
Entry: ₹155
Stop

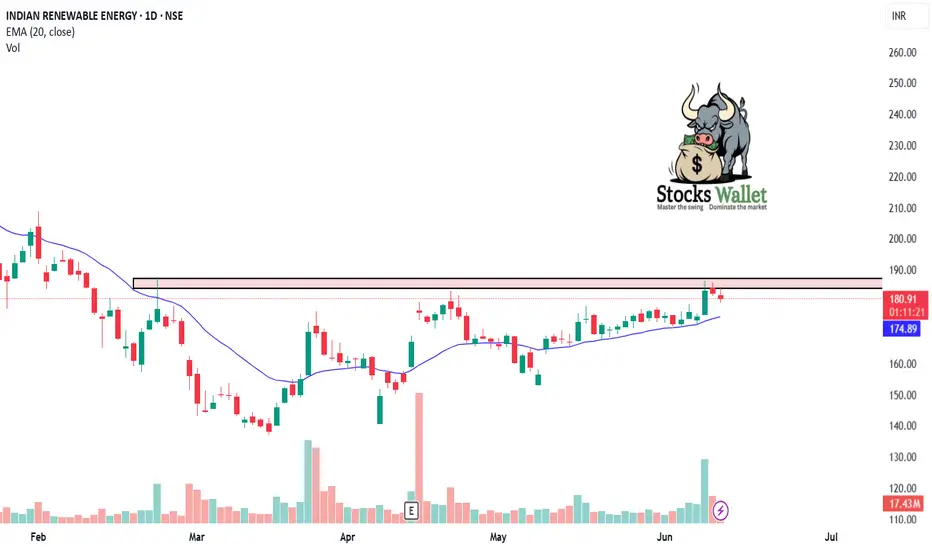
IREDA: Double Bottom in PlayOn the daily time frame, the chart of IREDA has recently displayed a double bottom reversal pattern , a classic technical formation often associated with a potential shift from bearish to bullish sentiment. This pattern, marked clearly on the chart, suggests that buyers may be stepping in at a pr
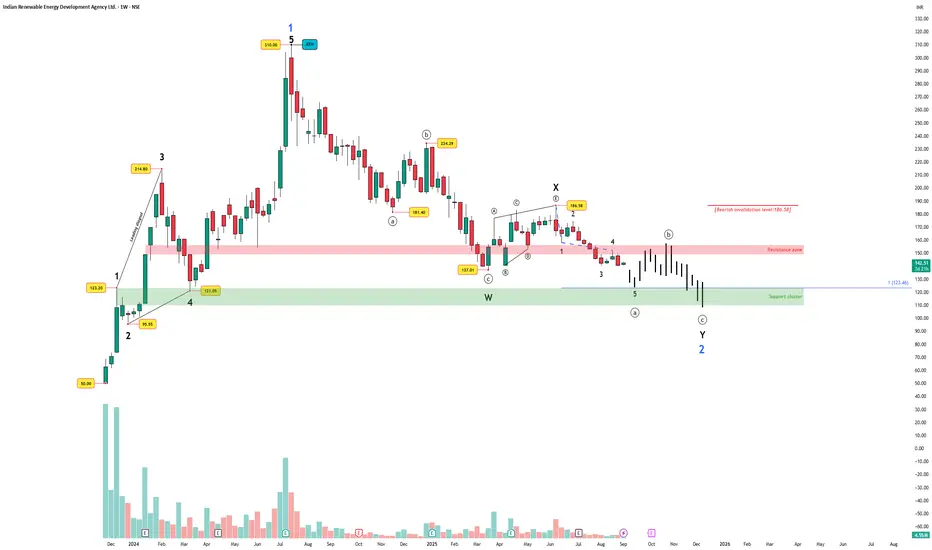
IREDA – Support Zone in Focus During Wave 2The rally from ₹50 → ₹310 unfolded in a clean 5-wave impulse, marking the completion of Wave 1.
Since then, the decline has been unfolding as a W–X–Y correction , currently progressing inside Wave 2. The ongoing drop is an unfinished Wave (a), projected toward the support cluster around ₹123–110
Scanner Picks: 15 Indian Stocks Down 30–50% from ATHA quick scan across the Indian markets threw up dozens of names trading well below their all-time highs. Out of those, here are 15 that stood out — each down between 30% and as low as 56% from ATH to recent close.
Scanner Output – % Declines from ATH → Recent Close
Inox Wind –43%
ABB India –4

IREDA – Strong Bullish Continuation Setup After Healthy Consolid⚡ IREDA – Strong Bullish Continuation Setup After Healthy Consolidation
Chart: IREDA – Daily Timeframe
IREDA is showing a bullish continuation pattern after consolidating in a tight range near ₹140. The stock has formed a higher low structure, and recent breakout candles with rising volume suggest a
See all ideas
Summarizing what the indicators are suggesting.
Neutral
SellBuy
Strong sellStrong buy
Strong sellSellNeutralBuyStrong buy
Neutral
SellBuy
Strong sellStrong buy
Strong sellSellNeutralBuyStrong buy
Neutral
SellBuy
Strong sellStrong buy
Strong sellSellNeutralBuyStrong buy
An aggregate view of professional's ratings.
Neutral
SellBuy
Strong sellStrong buy
Strong sellSellNeutralBuyStrong buy
Neutral
SellBuy
Strong sellStrong buy
Strong sellSellNeutralBuyStrong buy
Neutral
SellBuy
Strong sellStrong buy
Strong sellSellNeutralBuyStrong buy
Displays a symbol's price movements over previous years to identify recurring trends.
855IREDA34
Indian Renewable Energy Development Agency Limited 8.55% 13-MAR-2034Yield to maturity
5.12%
Maturity date
Mar 13, 2034
880IREDA34
Indian Renewable Energy Development Agency Limited 8.8% 13-MAR-2034Yield to maturity
4.95%
Maturity date
Mar 13, 2034
768IREDA36
Indian Renewable Energy Development Agency Limited 7.68% 21-JAN-2036Yield to maturity
4.77%
Maturity date
Jan 21, 2036
749IREDA31
Indian Renewable Energy Development Agency Limited 7.49% 21-JAN-2031Yield to maturity
4.71%
Maturity date
Jan 21, 2031
743IREDA36
Indian Renewable Energy Development Agency Limited 7.43% 21-JAN-2036Yield to maturity
4.28%
Maturity date
Jan 21, 2036
774IREDA31
Indian Renewable Energy Development Agency Limited 7.74% 21-JAN-2031Yield to maturity
4.14%
Maturity date
Jan 21, 2031
855IREDA29
Indian Renewable Energy Development Agency Limited 8.55% 13-MAR-2029Yield to maturity
3.99%
Maturity date
Mar 13, 2029
880IREDA29
Indian Renewable Energy Development Agency Limited 8.8% 13-MAR-2029Yield to maturity
3.28%
Maturity date
Mar 13, 2029
753IREDA26
Indian Renewable Energy Development Agency Limited 7.53% 21-JAN-2026Yield to maturity
−19.02%
Maturity date
Jan 21, 2026
728IREDA26
Indian Renewable Energy Development Agency Limited 7.28% 21-JAN-2026Yield to maturity
−48.69%
Maturity date
Jan 21, 2026
728IREDA35
Indian Renewable Energy Development Agency Limited 7.28% 21-JAN-2035Yield to maturity
—
Maturity date
Jan 21, 2035
See all IREDA bonds
FID
Franklin FTSE India Index ETF Trust UnitsWeight
0.07%
Market value
1.93 M
USD
FLXI
Franklin FTSE India UCITS USDWeight
0.07%
Market value
1.18 M
USD
VFEA
Vanguard FTSE Emerging Markets UCITS ETF AccumUSDWeight
0.01%
Market value
623.36 K
USD
MIDCAPETF
Mirae Asset Nifty Midcap 150 ETF Exchange Traded Fund UnitsWeight
0.32%
Market value
451.92 K
USD
LICNMID100
LIC MF Nifty Midcap 100 ETF Exchange Traded Fund UnitsWeight
0.39%
Market value
326.76 K
USD
Explore more ETFs
Frequently Asked Questions
The current price of IREDA is 149.50 INR — it has decreased by −0.03% in the past 24 hours. Watch Indian Renewable Energy Development Agency Ltd. stock price performance more closely on the chart.
Depending on the exchange, the stock ticker may vary. For instance, on BSE exchange Indian Renewable Energy Development Agency Ltd. stocks are traded under the ticker IREDA.
IREDA stock has risen by 1.18% compared to the previous week, the month change is a −4.63% fall, over the last year Indian Renewable Energy Development Agency Ltd. has showed a −20.37% decrease.
IREDA reached its all-time high on Jul 15, 2024 with the price of 310.00 INR, and its all-time low was 50.00 INR and was reached on Nov 29, 2023. View more price dynamics on IREDA chart.
See other stocks reaching their highest and lowest prices.
See other stocks reaching their highest and lowest prices.
IREDA stock is 1.72% volatile and has beta coefficient of 2.26. Track Indian Renewable Energy Development Agency Ltd. stock price on the chart and check out the list of the most volatile stocks — is Indian Renewable Energy Development Agency Ltd. there?
Today Indian Renewable Energy Development Agency Ltd. has the market capitalization of 419.98 B, it has increased by 1.55% over the last week.
Yes, you can track Indian Renewable Energy Development Agency Ltd. financials in yearly and quarterly reports right on TradingView.
Indian Renewable Energy Development Agency Ltd. is going to release the next earnings report on Jan 19, 2026. Keep track of upcoming events with our Earnings Calendar.
IREDA net income for the last quarter is 5.49 B INR, while the quarter before that showed 2.47 B INR of net income which accounts for 122.51% change. Track more Indian Renewable Energy Development Agency Ltd. financial stats to get the full picture.
No, IREDA doesn't pay any dividends to its shareholders. But don't worry, we've prepared a list of high-dividend stocks for you.
As of Nov 16, 2025, the company has 166 employees. See our rating of the largest employees — is Indian Renewable Energy Development Agency Ltd. on this list?
EBITDA measures a company's operating performance, its growth signifies an improvement in the efficiency of a company. Indian Renewable Energy Development Agency Ltd. EBITDA is 52.82 B INR, and current EBITDA margin is 98.28%. See more stats in Indian Renewable Energy Development Agency Ltd. financial statements.
Like other stocks, IREDA shares are traded on stock exchanges, e.g. Nasdaq, Nyse, Euronext, and the easiest way to buy them is through an online stock broker. To do this, you need to open an account and follow a broker's procedures, then start trading. You can trade Indian Renewable Energy Development Agency Ltd. stock right from TradingView charts — choose your broker and connect to your account.
Investing in stocks requires a comprehensive research: you should carefully study all the available data, e.g. company's financials, related news, and its technical analysis. So Indian Renewable Energy Development Agency Ltd. technincal analysis shows the strong sell today, and its 1 week rating is strong sell. Since market conditions are prone to changes, it's worth looking a bit further into the future — according to the 1 month rating Indian Renewable Energy Development Agency Ltd. stock shows the sell signal. See more of Indian Renewable Energy Development Agency Ltd. technicals for a more comprehensive analysis.
If you're still not sure, try looking for inspiration in our curated watchlists.
If you're still not sure, try looking for inspiration in our curated watchlists.