KELLTONTEC Price Action## Kellton Tech Solutions Price Analysis (August 2025)
### Price & Market Metrics
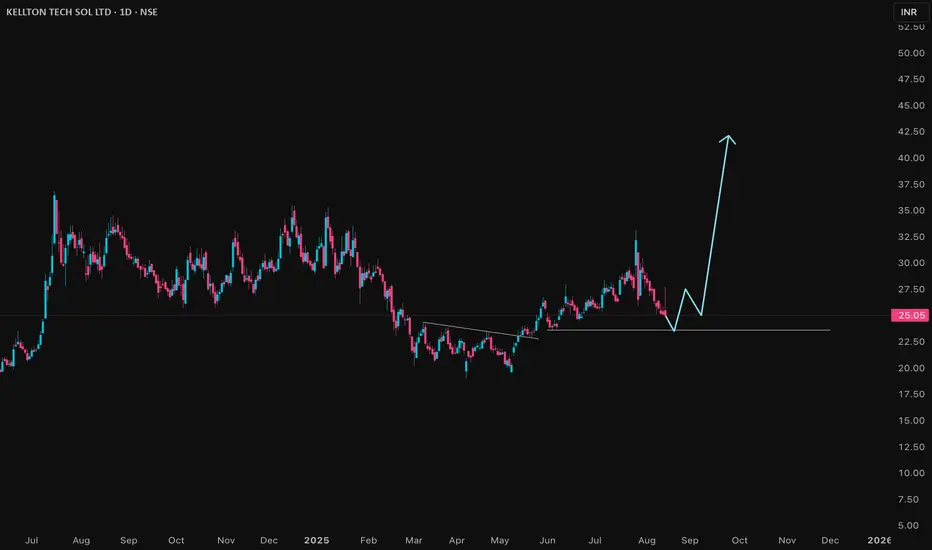
- Current share price: ₹25.01 (NSE).
- Market capitalization: Approximately ₹1,233 crore.
- 52-week price range: ₹19.00 (low) to ₹35.50 (high).
- Day's trading range recently: ₹24.80 to ₹27.70.
- Recent price change:
Next report date
—
Report period
—
EPS estimate
—
Revenue estimate
—
1.69 INR
797.24 M INR
10.98 B INR
304.34 M
About Kellton Tech Solutions Ltd.
Sector
Industry
CEO
Krishna Chintam Reddy
Website
Headquarters
Hyderabad
Founded
1993
ISIN
INE164B01030
FIGI
BBG000F3PLD8
Kellton Tech Solutions Ltd. engages in the provision of information technology solutions.The firm operates through the following segments: Digital Transformation, Enterprise Solutions, and Consulting. Its products and platforms include kellton4media, klgame, optima, and thrive. The company was founded by Niranjan Reddy Chintam on December 31, 1993 and is headquartered in Hyderabad, India.
Related stocks
BUY TODAY SELL TOMORROW for 5%DON’T HAVE TIME TO MANAGE YOUR TRADES?
- Take BTST trades at 3:25 pm every day
- Try to exit by taking 4-7% profit of each trade
- SL can also be maintained as closing below the low of the breakout candle
Now, why do I prefer BTST over swing trades? The primary reason is that I have observed that

KellonTech Solution - H &S Pattern Formation WTFKellonTech Solution - H &S Pattern Formation on WTF. Pattern Target -210
SL - 142

Long Kellton techgood improving fundamentals
recently made higher highs and broke previous days high
low risk high reward setup
cmp 150
sl 135
target 200

Kellton Tec - Might head towards all time high and surpass itKellton Tec - Might head towards all time high and surpass it this time to hit 200+ levels..
Good to Go Long with todays low as SL

Breakout in Kellton!Chart -> Kellton Tech Daily
CMP: 151
Targets: 165, 182
SL: 147 Daily Close
Disclaimer: This is for educational purposes only, not any recommendations to buy or sell. As I am not SEBI registered, please consult your financial advisor before taking any action.


KELLTONTEC - 2.5 year long Cup & Handle Pattern BreakoutHere's a technical analysis of the KELLTONTEC stock chart:
Key Observations
Cup and Handle Pattern:
The chart shows a cup and handle formation, which is a bullish continuation pattern indicating the potential for an upward breakout. The "cup" forms after a rounded bottom, and the "handle" repres

KELLTON Trendline breakoutafter rallying 100% it has consolidated for almost 4months. followed by giving a trendline breakout.
breakout was with a good volume.
yesterday closed near day-high.

Kellton TechKellton Tech had given the all time high breakout and then come into the correction/consolidation mode.
Now it is taking support at the ATH breakout and ready for the breakout of the correction.

See all ideas
Summarizing what the indicators are suggesting.
Neutral
SellBuy
Strong sellStrong buy
Strong sellSellNeutralBuyStrong buy
Neutral
SellBuy
Strong sellStrong buy
Strong sellSellNeutralBuyStrong buy
Neutral
SellBuy
Strong sellStrong buy
Strong sellSellNeutralBuyStrong buy
An aggregate view of professional's ratings.
Neutral
SellBuy
Strong sellStrong buy
Strong sellSellNeutralBuyStrong buy
Neutral
SellBuy
Strong sellStrong buy
Strong sellSellNeutralBuyStrong buy
Neutral
SellBuy
Strong sellStrong buy
Strong sellSellNeutralBuyStrong buy
Displays a symbol's price movements over previous years to identify recurring trends.
Frequently Asked Questions
The current price of KELLTONTEC is 23.84 INR — it has decreased by −0.34% in the past 24 hours. Watch Kellton Tech Solutions Ltd. stock price performance more closely on the chart.
Depending on the exchange, the stock ticker may vary. For instance, on BSE exchange Kellton Tech Solutions Ltd. stocks are traded under the ticker KELLTONTEC.
KELLTONTEC stock has fallen by −0.71% compared to the previous week, the month change is a −9.06% fall, over the last year Kellton Tech Solutions Ltd. has showed a −22.50% decrease.
We've gathered analysts' opinions on Kellton Tech Solutions Ltd. future price: according to them, KELLTONTEC price has a max estimate of 32.85 INR and a min estimate of 32.85 INR. Watch KELLTONTEC chart and read a more detailed Kellton Tech Solutions Ltd. stock forecast: see what analysts think of Kellton Tech Solutions Ltd. and suggest that you do with its stocks.
KELLTONTEC reached its all-time high on Jul 15, 2024 with the price of 36.86 INR, and its all-time low was 0.73 INR and was reached on Dec 12, 2013. View more price dynamics on KELLTONTEC chart.
See other stocks reaching their highest and lowest prices.
See other stocks reaching their highest and lowest prices.
KELLTONTEC stock is 0.68% volatile and has beta coefficient of 1.80. Track Kellton Tech Solutions Ltd. stock price on the chart and check out the list of the most volatile stocks — is Kellton Tech Solutions Ltd. there?
Today Kellton Tech Solutions Ltd. has the market capitalization of 12.22 B, it has increased by 0.50% over the last week.
Yes, you can track Kellton Tech Solutions Ltd. financials in yearly and quarterly reports right on TradingView.
Kellton Tech Solutions Ltd. is going to release the next earnings report on Nov 17, 2025. Keep track of upcoming events with our Earnings Calendar.
KELLTONTEC net income for the last quarter is 226.51 M INR, while the quarter before that showed 191.96 M INR of net income which accounts for 18.00% change. Track more Kellton Tech Solutions Ltd. financial stats to get the full picture.
Kellton Tech Solutions Ltd. dividend yield was 0.00% in 2024, and payout ratio reached 0.00%. The year before the numbers were 0.00% and 0.00% correspondingly. See high-dividend stocks and find more opportunities for your portfolio.
As of Oct 10, 2025, the company has 1.46 K employees. See our rating of the largest employees — is Kellton Tech Solutions Ltd. on this list?
EBITDA measures a company's operating performance, its growth signifies an improvement in the efficiency of a company. Kellton Tech Solutions Ltd. EBITDA is 1.31 B INR, and current EBITDA margin is 11.69%. See more stats in Kellton Tech Solutions Ltd. financial statements.
Like other stocks, KELLTONTEC shares are traded on stock exchanges, e.g. Nasdaq, Nyse, Euronext, and the easiest way to buy them is through an online stock broker. To do this, you need to open an account and follow a broker's procedures, then start trading. You can trade Kellton Tech Solutions Ltd. stock right from TradingView charts — choose your broker and connect to your account.
Investing in stocks requires a comprehensive research: you should carefully study all the available data, e.g. company's financials, related news, and its technical analysis. So Kellton Tech Solutions Ltd. technincal analysis shows the sell today, and its 1 week rating is sell. Since market conditions are prone to changes, it's worth looking a bit further into the future — according to the 1 month rating Kellton Tech Solutions Ltd. stock shows the neutral signal. See more of Kellton Tech Solutions Ltd. technicals for a more comprehensive analysis.
If you're still not sure, try looking for inspiration in our curated watchlists.
If you're still not sure, try looking for inspiration in our curated watchlists.