KPIT TECH Medium term setupKPIT Tech for the medium timeframe (6+months)
• 61% retracement done of 26sep-12feb trend
• Resistance broken should now act as a support
• On the downside, 1550 should not break for swing traders & 1400 should not break for medium-term traders
KPITTECH trade ideas

KPIT TECH - Price analysis & observation1. Currently it is consolidating, if it breaks upside we can look for the marked targets.
2. No new entry as RRR is not favourable.
3. I'm holding it from the bottom and trailing the SL aggressively.
- Stay tuned for further insights, updates and trade safely!
- If you liked the analysis, don't forget to leave a comment and boost the post. Happy trading!
Disclaimer: This is NOT a buy/sell recommendation. This post is meant for learning purposes only. Please, do your due diligence before investing.
Thanks & Regards,
Anubrata Ray

KPIT Analysis! Ascending triangle!!KPIT Weekly Analysis
Ascending Triangle Pattern Formation in KPIT
KPIT has made Ascending Triangle Patern on Weekly Timeframe. KPIT has giver breakout at it's resistance level and trying to retest the level to establish the support over there. 805-829 is the support zone range. Price may take support at this zone and move further up towards our projected profit.
Trading Psychology - Aggresive investors can initiate buy at current price level and Conservative investers can initiate buy above 945 levels.
Entry - Current Level or Above 945
Taregt - 1992.35
Stop Loss- Below 737.25
If you like my analysis please do boost and share. I want support from you guys to help our trading community to achieve an edge in Technical Analysis
Disclaimer - All my analysis are for Educational Purpose only. Before entering into any trade - 1) Educate Yourself 2)Do your own research and analysis 3)Define your Risk to Reward ratio 3)Don't trade with full capital

KPITTECH GOOD FOR SWING TRADEStock Analysis: KIOCL LTD
Date: June 26, 2024
Observation:
KIOCL LTD is showing strong resistance around the 475 INR level, as indicated by the black horizontal trendline.
The stock has been consolidating just below this resistance level.
A breakout above this level could indicate a bullish continuation.
Technical Indicators:
Price Action: The stock closed at 458.65 INR, showing a negative movement of -3.12% for the day.
Volume: Increasing volume indicates growing buying interest as the price approaches resistance.
Moving Average: The blue line represents the 50-day moving average, providing support and confirming the upward trend.
Potential Scenarios:
Bullish Breakout: If the stock breaks above the resistance level with strong volume, it could indicate a bullish trend continuation.
Rejection at Resistance: If the stock fails to break through the resistance, it may pull back to support levels around 425 INR.
Trading Plan:
Entry: Consider entering a long position above 475 INR with confirmation of increased volume.
Stop-Loss: Set a stop-loss below the recent low at 450 INR to manage risk.
Target: Initial target can be set at 500 INR, with further upside potential if the breakout is strong.
Hashtags:
#StockMarket #TradingView #TechnicalAnalysis #KIOCL #SwingTrading #BreakoutTrading
Disclaimer:
This analysis is for informational purposes only and should not be considered as investment advice. Trading in financial markets involves risk, and you should consult with a qualified financial advisor before making any investment decisions. Past performance is not indicative of future results. Always conduct your own research and due diligence before making any trades.

[Swing Trade] KPITTECH 1588KPITTECH just got out of consolidation. Would it make ATH? All eyes on it...building up the volumes very nicely :-)
DYOR - This is not buy or sell reco

KPITTECH - good time to accumulateNSE:KPITTECH
cmp 1476
can be accumulated between 1640-1350 and be ready to hold for 3-4 months
keep a watch for weekly close above 1765
should do well above 1765
The objective of this analysis is knowledge sharing and education. There isn't any buy or sell advise in this article. Every stock is held for a short to medium amount of time and is positional.
It is expected of each person to carry out independent research and evaluation to ascertain whether my perspective is consistent with your studies.

Multibegger fundamentally strongBuy at cmp @330 sl 310 cb
Target 1 345
Target 2 360
Target 3 375
Target 4 400+++

KPIT - Possible VCP Formation - Best above -1570KPIT - Possible VCP formation. Should Breakout with good volumes
Safe buy Above - 1570
Target - 1726
Above 1726 - Open Sky
Views Invalid below - 1500

Breakout soon in KPITVolatility Contraction
RSI above 60 and rising
Trading above EMA50
Volume increasing
Enter after confirmation
Disc: for study, not a recommendation

#Kpittech cash : Looks good above 1600 levels only#KpitTechnologies cash : Positional call
25.05.2024
Looks good above 1600 levels only and
dips 1560-1570
Stoploss 1520
Target 1680/1800/2000
Cmp 1552

KPIT Tech might cross the resistance levelsKPIT Tech has been showing signs of bounching back up after some down moves and has formed an upward triangle pattern showing less signs of the fall. It seems that with the current strengh it can break the resistance levels of 1530.
If the breakout is supported by Good volumes then it can give us the levels of 1562-1593-1635-1671-1763 with the base levels of 1473-1406-1391.
Overall market conditions and volitality should be in favour to support its move.
No recommendations, Just my view based on chart pattern.

ICT + Technicals KPIT has just released another solid quarter with its highest ever profits and highest ever earnings. Solid fundamentally and has a protected growth of about 22% in its revenue.
ICT concepts
Solid liquidity grab and MSS only caution is, it is trading at its 0.5 fib or equilibrium.
Taken solid support from trend line and moves up with increased volume with moves down with low volume and a good sign to see to understand buying and selling pressure.
Stop below 200ema serves appropriate
Keep It Simple

Trendline breakout in KPITInvesting in futuristic stocks is always an great opportunity KPIT has already gave an breakout but it is still buying/consolidation range

KPITTECH 'W' CHART PATTERNCMP 1540
1st Target 1610
2nd Target 1680
3rd Target 1725
Stop loss 1470
W Pattern in Stock Market:
W pattern in stock market is a technical analysis chart pattern that resembles the letter “W” and typically indicates a potential reversal in the direction of a stock’s price movement. This pattern consists of two consecutive troughs (low points) separated by a higher peak (high point) in between, forming the shape of a W .

kpit tech breakout with "w" pattern with volume pop upwe have also seen growth in q4 result.
cmp 1546
target expected 10-20% upmove

KPITTECH 1:9.5+ RR trade set up1. Set up: Reversal
2. Trend Bullish
4. SL lucrative with less then 3%
5. RR 1:9.5+

KPITTECHHonestly, All Brokerage reports downgrade time by time and buy the stocks from retails.
The stock showing its outperforms continue...
Management is very strong, incase one Quarter result is bad it's buying opportunity because company management is very strong and it make profits again and same beat estimates.

KPITTECH Long Trade Idea🔔 BUY Signal Alert! 🔔
🔗 Ticker: KPITTECH
🌐 Market: India Equities
🔄 Side: Long
⏱️ Type: Swing Trade
🎯 Entry: 1511
🛑 Stop Loss: 1472.4
🥇 First Profit Target: 1563.4
🏆 Final Profit Target: 1598.6
The CHAMLEO EDGE model uses a proprietary algorithmic program at the pre-market auction to identify potential stocks for each day. The algorithm then calculates where there is strong buying or selling pressure on the stock and sends buy or sell signals.
The signal provides a suggested stop loss price based on calculations that the movement may no longer be valid. It also provides a first suggested level for realizing potential profits, indicating that there is a resistance level just beyond this price that may cause the stock to stop and possibly reverse. If this level is surpassed, there is potential to achieve possible profits at a price better than the first profit level, allowing the possibility of extending potential gains.

KPIT tech - good support -fishing at the dipKPIT took long term support - concentrate in this levels

KPIT TECHNOLOGY REVERSAL NSE:KPITTECH
Strong support:- 1354
Tested twise on daily pattern and shown sign of reversal in 3 hourly pattern ( tested support thrice)
Rsi is in oversold zone .
Wait for green candle to buy .
My startegy:- buy above high stoploss bellow low . 🙂
What's your analysis?

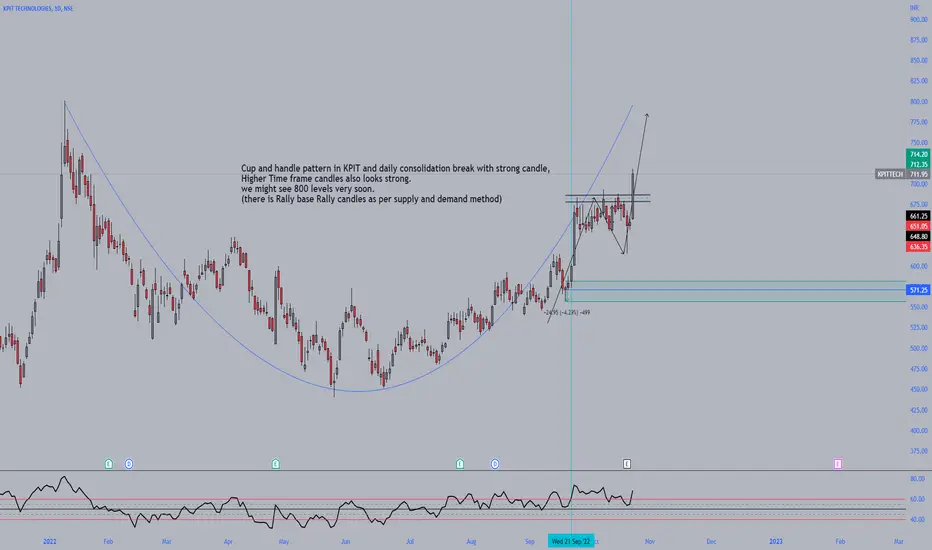
KPIT - Strong consolidation breakout and Cup-handle pattern.Cup and handle pattern in KPIT and daily consolidation break with strong candle,
Higher Time frame candles (M/W)also looks strong.
we might see 800 levels very soon.
(there is Rally base Rally candles as per supply and demand method)
-Educational purpose.
KPIT ready to take offKPITTECH has given a box breakout and is in a strong uptrend with the sector being bullish too. One can look to make entries around cmp. The breakout is on back of a false breakdown which gives the trade more confidence. Stop loss should be around 1425

KPIT TECHNOLOGY--BREAK OUTAll the information given in the chart is for the educational purpose only.
~Do your own research before investing.
~This is not my recommendation.
~My recommendation--LEARN MORE EARN MORE.
