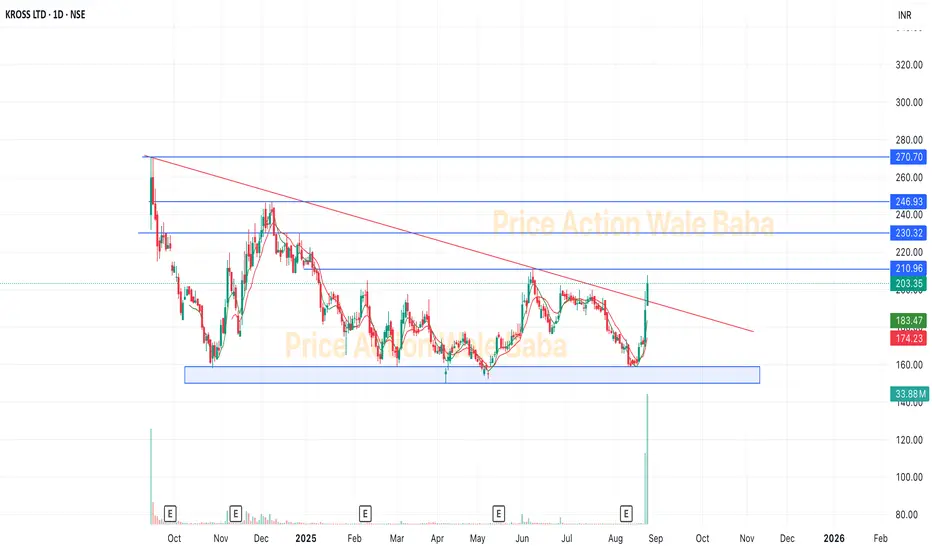
Kross cmp 224 by Daily Chart view since listedKross cmp 224 by Daily Chart view since listed
- Support Zone 187 to 206 Price Band
- Resistance Zone 222 to 239 Price Band
- Bullish Rounding Bottoms followed by Cup & Handle
- Falling Resistance Trendline Breakout seems in progress
- Resistance Zone Breakout anticipated by steady attempts
- Volum
Kross Limited
No trades
7.75 INR
480.27 M INR
6.20 B INR
23.17 M
About Kross Limited
Sector
Industry
CEO
Sudhir Rai
Website
Headquarters
Jamshedpur
Founded
1991
IPO date
Sep 16, 2024
Identifiers
2
ISIN INE0O6601022
Kross Ltd. engages in the manufacture and supply of auto-components for medium and heavy commercial vehicles (M&HCV) and farm equipment. It offers trailer axle and suspension assembly and a wide range of forged, and precision machined high performance safety critical parts. The company was founded on May 9, 1991 and is headquartered in Jamshedpur, India.
Related stocks

BUY TODAY SELL TOMORROW for 5%DON’T HAVE TIME TO MANAGE YOUR TRADES?
- Take BTST trades at 3:25 pm every day
- Try to exit by taking 4-7% profit of each trade
- SL can also be maintained as closing below the low of the breakout candle
Now, why do I prefer BTST over swing trades? The primary reason is that I have observed that

Kross cmp 176.22 by Daily Chart view since listedKross cmp 176.22 by Daily Chart view since listed
- Support Zone 156 to 166 Price Band
- Resistance Zone 180 to 192 Price Band
- Volume attempting sync with avg traded qty
- Bullish Double Bottom "W" with Support Zone base
- Falling Resistance Trendline Breakout has well sustained
- Resistance Zon

Breakout Soon Stock: Kross Ltd.Introduction:
Kross Manufacturers (India) Pvt Ltd is a leading supplier to OEMs, KROSS is an acknowledged specialist in manufacturing a wide variety of critical automobile components like Universal Joints, Diff. Spiders, Axle Shafts, Spindles, Companion Flanges and many critical Tractor Parts- lik

KROSS - BreakoutCross look good above 215-220
Good volume comes at bottom which give sign of healthy buying. Consolidation ended here and ready to give upside movement.
Good to buy and hold for the next 6-12 months for the better returns.
KROSS LTD – Reversal on Cards?Chart Setup (Weekly)
KROSS LTD is showing strong signs of reversal after multiple rejections at a key support zone. Recent price action is accompanied by strong volume participation, indicating accumulation and potential breakout momentum.
🔑 Key Levels
Entry Zone: Above ₹210 (confirmation breakout

BUY TODAY SELL TOMORROW for 5% DON’T HAVE TIME TO MANAGE YOUR TRADES?
- Take BTST trades at 3:25 pm every day
- Try to exit by taking 4-7% profit of each trade
- SL can also be maintained as closing below the low of the breakout candle
Now, why do I prefer BTST over swing trades? The primary reason is that I have observed t

KROSS - Ready For IPO Base BreakoutKROSS - Ready For IPO Base Breakout
Price is consolidating tightly near resistance zone, indicating reduced selling pressure and potential for a breakout. ₹225-₹230 serves as the breakout level.
Volume Trends:
Volume decreased during the handle formation, showing healthy consolidation.
Expect a

KROSS : IPO Base Breakout Soon#Kross #breakoutstock #breakoutsoon #breakoutcandidate #trendingstock
KROSS : IPO Base Breakout Soon
>> Good Base formation
>> Entry on Closing Above GAP Area
>> Good Strength & Volumes Building up
>> Trending setup
>> High Probability Trade
Swing Traders can lock 10% profit & keep trailing
Note

Targeting IPO high againChart -> Kross Ltd Daily
IPO listing, decline, created base and breakout. Targeting IPO listing high again!
CMP: 219
Good Range To Buy: 210 to 220
Targets: 236, 270
SL: 200 Daily Close
Disclaimer: This is for educational purposes only, not any recommendations to buy or sell. As I am not SEBI regi

See all ideas
Summarizing what the indicators are suggesting.
Oscillators
Neutral
SellBuy
Strong sellStrong buy
Strong sellSellNeutralBuyStrong buy
Oscillators
Neutral
SellBuy
Strong sellStrong buy
Strong sellSellNeutralBuyStrong buy
Summary
Neutral
SellBuy
Strong sellStrong buy
Strong sellSellNeutralBuyStrong buy
Summary
Neutral
SellBuy
Strong sellStrong buy
Strong sellSellNeutralBuyStrong buy
Summary
Neutral
SellBuy
Strong sellStrong buy
Strong sellSellNeutralBuyStrong buy
Moving Averages
Neutral
SellBuy
Strong sellStrong buy
Strong sellSellNeutralBuyStrong buy
Moving Averages
Neutral
SellBuy
Strong sellStrong buy
Strong sellSellNeutralBuyStrong buy
Displays a symbol's price movements over previous years to identify recurring trends.
Frequently Asked Questions
The current price of KROSS is 224.05 INR — it has increased by 2.59% in the past 24 hours. Watch Kross Limited stock price performance more closely on the chart.
Depending on the exchange, the stock ticker may vary. For instance, on BSE exchange Kross Limited stocks are traded under the ticker KROSS.
KROSS stock has risen by 5.99% compared to the previous week, the month change is a 11.00% rise, over the last year Kross Limited has showed a 52.78% increase.
KROSS reached its all-time high on Sep 16, 2024 with the price of 271.00 INR, and its all-time low was 131.15 INR and was reached on Apr 7, 2025. View more price dynamics on KROSS chart.
See other stocks reaching their highest and lowest prices.
See other stocks reaching their highest and lowest prices.
KROSS stock is 3.74% volatile and has beta coefficient of 1.56. Track Kross Limited stock price on the chart and check out the list of the most volatile stocks — is Kross Limited there?
Today Kross Limited has the market capitalization of 13.96 B, it has increased by 4.51% over the last week.
Yes, you can track Kross Limited financials in yearly and quarterly reports right on TradingView.
KROSS net income for the last quarter is 139.81 M INR, while the quarter before that showed 80.84 M INR of net income which accounts for 72.95% change. Track more Kross Limited financial stats to get the full picture.
No, KROSS doesn't pay any dividends to its shareholders. But don't worry, we've prepared a list of high-dividend stocks for you.
As of Feb 17, 2026, the company has 543 employees. See our rating of the largest employees — is Kross Limited on this list?
EBITDA measures a company's operating performance, its growth signifies an improvement in the efficiency of a company. Kross Limited EBITDA is 811.64 M INR, and current EBITDA margin is 13.23%. See more stats in Kross Limited financial statements.
Like other stocks, KROSS shares are traded on stock exchanges, e.g. Nasdaq, Nyse, Euronext, and the easiest way to buy them is through an online stock broker. To do this, you need to open an account and follow a broker's procedures, then start trading. You can trade Kross Limited stock right from TradingView charts — choose your broker and connect to your account.
Investing in stocks requires a comprehensive research: you should carefully study all the available data, e.g. company's financials, related news, and its technical analysis. So Kross Limited technincal analysis shows the buy rating today, and its 1 week rating is buy. Since market conditions are prone to changes, it's worth looking a bit further into the future — according to the 1 month rating Kross Limited stock shows the strong buy signal. See more of Kross Limited technicals for a more comprehensive analysis.
If you're still not sure, try looking for inspiration in our curated watchlists.
If you're still not sure, try looking for inspiration in our curated watchlists.