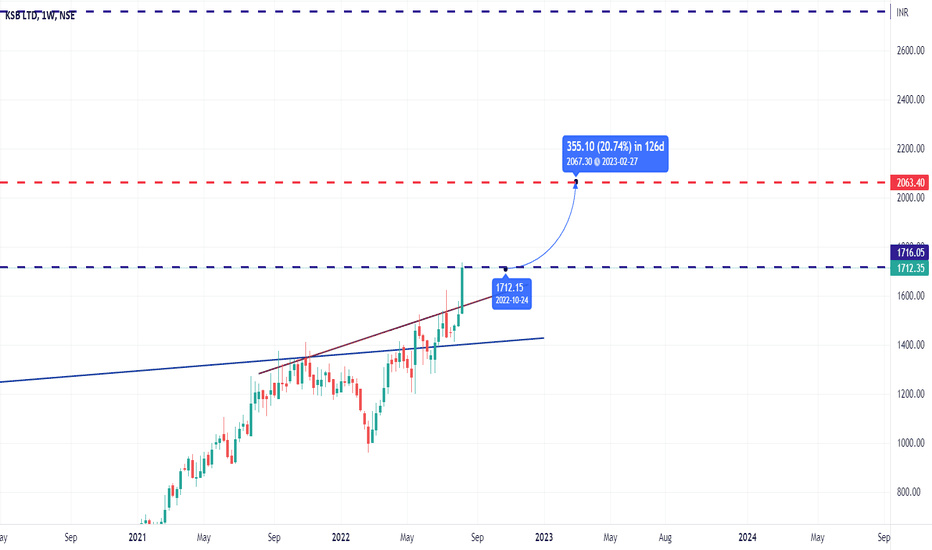
KSB trade ideas
KSB| Good for Long NSE:KSB
Reason for Trade : BO on Daily Time Frame
Cmp : 1712
Entry : CMP or near 1700
Stop Loss: According to one's Risk Reward ratio
#Study, Learn & Earn.
If you love this post please like and comment your thoughts below. That will be a great motivation for me to post similar ideas ahead.
Disclaimer: All the information posting on this page are for the educational purpose only, we are not SEBI registered financial advisor. We wont recommend any BUY/SELL of stocks. Contact your financial advisor before taking any action
KSB - Ichimoku Bullish Breakout Ichimoku Cloud Setup :
1). Today's close is above the Conversion Line
2). Future Kumo is Turning Bullish
3). Chikou span is slanting upwards
All these parameters are showing bullishness at Current Market Price
and more bullishness AFTER crossing 1735
#This is not Buy and Sell recommendation to any one. This is for education purpose and a helping hand to learn trading in Market.
# Cloud Trading
# Ichimoku Cloud
# Ichimoku Followers
I hope you all like my analysis.
Please do share your thoughts into comment section.
Please give a like, it motivates me to do analysis.
Buy Today, Sell Tomorrow: KSBDON'T HAVE TIME TO MANAGE YOUR TRADES?
- Take BTST trades at 3:25 pm every day
- Book profits within the first 30 minutes of the market opening
- Try to exit by taking 3-5% profit of each trade
- SL can be taken when the 5/15 min candle closes below 44EMA
- SL can also be maintained as 1% or closing below the low of the breakout candle
The levels mentioned on the chart are calculated using BREAKOUT INDICATOR
Now, why do I prefer BTST over swing trades? The primary reason is that I have observed that 90% of the stocks give most of the movement in just 1-2 days and the rest of the time they either consolidate or fall
Resistance Breakout in KSB
Buy Today, Sell Tomorrow: KSB
POSSIBLE LONG MOVE | ASCENDING TRIANGLE BREAKOUTTHE CHART IS SELF EXPLANATORY. The ascending triangle pattern has been broken with a good candle. We can expect a long run but remember every trade is 50/50 probability so always accept the risk before enter a trade.
Plan your trade according to your risk management.
This is not a call, purely for educational pupose.
CATCHING KSB LIMITEDKSB LIMITED IS MULTINATIONAL COMPANY. AFTER 3 YEARS OF CONSOLIDATION STOCK GAVE BEUTIFUL BREAK OUT AT 936 AND MADE RECENTLY ALL TIME HIGH 1105 AFTER THAT STOCK RETRACE 910 LEVEL OF SUPPORT. YESTERDAY SOCK TAKE SUPPORT AT 910 AND MAKE HAMMER PATERN AND TODAY ALSO IN LIVE TRADING SESSION RALLY CONTINOUS SO BUY AT CMP 1035
ENTERY LEVEL 1035
SL CLOSING BASIS 980
TARGET 1105-1150-1200
TIME DURATION 15 TRADING DAYS
KSB Ltd - 3.5 yr Rounding Bottom Breakout RetestThe stock made a bottom on low volume and then started its run up on increasing volumes. Gave a clean volume breakout and returned to test the breakout level. And look at the magnitude of the volume bar on a bounce back from BO level. Looks very strong.
SL: Depending on your risk appetite: Below Weekly BO Candle / Below Daily BO Candle / 50% of Weekly BO candle / Below 20DMA
TGT: After a 10-15%+ vertical move, breakdown of 20DMA (on a daily close basis)
BUY GUIDANCE:
Never ever buy before 3PM. I have been burnt many many times. Try to buy between 3:15 - 3:30PM, later the better.
SELL GUIDANCE:
Selling in Profit:
Sell earlier in the session when the prices are higher, around 11AM.
Selling at SL:
Give your stock a chance to recover by end of session. If it doesn't recover, sell anywhere between 3:00 - 3:30PM.
Note: I reserve the right to be wrong.
DISCLAIMER:
I am not a SEBI registered analyst. Please consult your financial advisor before investing.


