Short Term Buy in Mahindra EPCThe scrip has consolidated in a Roudning bottom and about to give a breakout.
Please refer chart for details.
Trade ideas

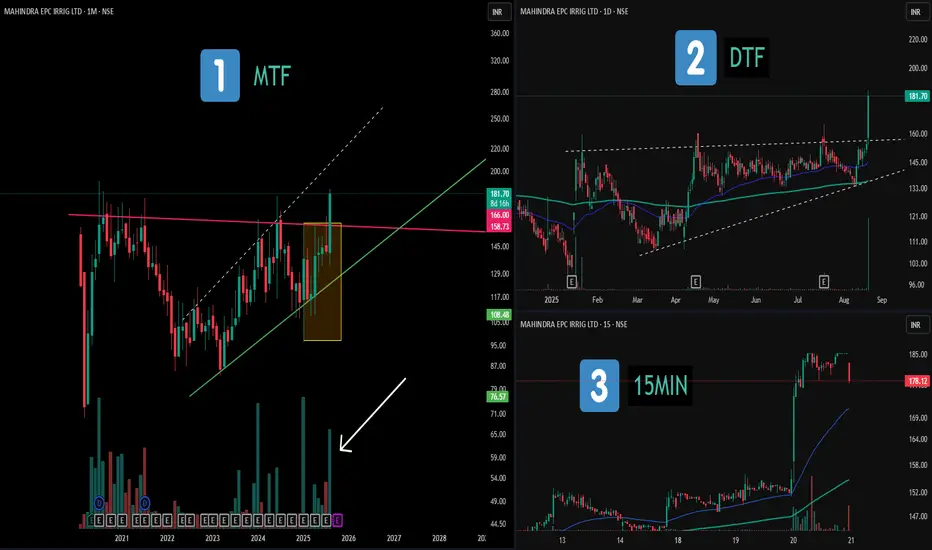
Multi-Timeframe Study: Consolidations and Patterns📝 Description:
1️⃣ MTF (Monthly) – Displays a broad consolidation structure with a hidden broadening formation and notable volume clusters marked in recent candles.
2️⃣ DTF (Daily) – Highlights an ascending triangle structure, with clear range boundaries and price compression before expansion.
3️⃣ 15MIN (Intraday) – Shows that the maximum price movement and volume activity occurred on a single candle, illustrating how momentum often concentrates in short bursts.
This chart setup serves as an educational view across multiple timeframes, showing how higher- and lower-TF structures can align.
⚠️ Disclaimer:
This post is purely for educational and structural analysis purposes. Not financial advice.
possible 10 years breakout irrigation stock MAHINDRA EPCMAHINDRA EPC IRRIGATION 3months chart, price is standing near 10 years trendline and a breakout on closing basis will give a good rally. This is agriculture related FMCG script.
Mahindra EPC Irrigation Ltd., incorporated in the year 1981, is a Small Cap company (having a market cap of Rs 409.26 Crore) operating in Irrigation & Allied Services sector.
Mahindra EPC Irrigation Ltd. key Products/Revenue Segments include Micro Irrigation Systems And Other Agri. Related Products

Breakout in Mahindra EPC Irrigation Ltd...Chart is self explanatory. Levels of breakout, possible up-moves (where stock may find resistances) and support (close below which, setup will be invalidated) are clearly defined.
Disclaimer: This is for demonstration and educational purpose only. This is not buying or selling recommendations. I am not SEBI registered. Please consult your financial advisor before taking any trade.

Double Bottom Pattern BreakoutPlease look into the chart for a detailed understanding.
Consider these for short-term & swing trades with 2% profit.
For BTST trades consider booking
target for 1%-2%
For long-term trades look out for resistance drawn above closing.
Please consider these ideas for educational purpose
Please note that, if there are some big targets, those are drawn thinking for long term.

Trend Breakout + Triple bottom✅Trend Breakout
✅ Triple bottom
✅High volume
✅ Getting rejection from lower levels
✅Rsi breaking zone
✅No gain After listing breaking zone first time

Mahaepc- 8 ka funda 100>200 fOR bIG tARGETSMahaepc- 8 ka funda 100>200 fOR bIG tARGETS
Days = 90 , gap = 1.05, range = 0.35
1) RAnge breakout possible
2) Trend line near breakout on weekly time frame
3) HIgh volume on Daily time frame

MAHINDRA EPC IRRIGATION - DAY CHART - 06.12.22 - BAHAVAN CAPITALMAHINDRA EPC IRRIGATION as per Day Chart Analysis Stock ABOVE 112 TARGET 116.
Happy Profitable Trading to All...


MAHEPC ......WEEKLY CHARTa beautiful candle form at the support zone in weekly time frame. keep eye on it
trade with risk reward ratio
trade in discipline
study purpose trade at your own risk......

MAHEPC IS LOOKING ATTRACTIVE AT THIS LEVEL It is near its buying zone
It is working in a channel
Looking really attractive at 130 levels
One can go long with SL of 124 on closing basis
Risk reward is really good 1:10
Forming a double bottom
Volume is dry when it was retracing volume will blast once it'll show some move

triangle pattern [ weekly ]Only for study purpose.........
pls like & comment what you feel about that
Thank you.


Mahindra EPC Ascending triangleNSE:MAHEPC
Buy on bounce above 152
or if brake support of 144
then buy near 135 on bounce from 130 or below
SL closing below 123
T 159, 170,
above 175 - 185, 194

MAHEPC Buy Current levelIt sEducation Purpose Could you pls Make your own Analysis before Trading.Breakout at Huge vol and retest the trend line.Target 1 - 194 target 2 -220 long hold


Definite Buy. Reasons can be seen in diagramReasons to buy
Cup and Handle formation
Bullish trend and resistance not reached yet
Bullish engulfing pattern with very good volume
RSI indicator positive
MACD indicator positive
Moving averages positive
Monthly and Weekly charts are also have bullish candles and bullish move is there so definitely good sign.

