Trade ideas

Descending Triangle Pattern - Breakout !! Matrimony.Com is involved in the business activities of Operation of web sites that use a search engine to generate and maintain extensive databases of internet addresses and content in an easily searchable format.
The Stock has formed a descending triangle Pattern on charts and there is a clear breakout. The stock from a technical standpoint is trading close to its 50DMA and comfortably placed above its 200DMA, around 17% above 200DMA. The RSI is at perfect levels to take long trade.
The Company is fundamentally sound. The company is debt free and has a strong balance sheet enabling it to report stable earnings growth. There has been a continuous increase in stake by FPI and mutual Funds.
Don't miss at these levels. Refer chart for Targets and SL.
Feel free to share your feedback and queries.

MATRIMONYWeekly chart - Multiple Inside candles + trendline breakout pattern. Trading near support. Good risk to reward trade

MATRIMONEY Share Flag Patternthe Matrimoney chart is good to buy current level your stop loss is the 795. add this share to the watchlist

Expecting Triangle Pattern Breakout ✌✌ This scrip is ready to fly and expected to give Maximum ( I'm not sure but minimum Return 5% within week) 20% Return Within a week. So traders keep on your radar and enjoy the profit.

Triangle Pattern ✌✌This Scrip is slowly Moving and is getting Ready To Move Upward. Keep on your Radar.


MATRIMONY: DESCENDING TRIANGLE BREAKOUTMatrimony.com Ltd. engages in the provision of matrimony services. It operates through the Matchmaking and Marriage Services segments. The Matchmaking Services segment manages online platform such as websites, mobile sites, and mobile applications. It services are delivered through through web portals including BharatMatrimony.com, CommunityMatrimony.com, AssistedMatrimony.com, and EliteMatrimony.com. The Marriage Services segment offers wedding photography and videography services through MatrimonyPhotography.com, Matrimonybazar.com, and Matrimonymandap.com. The company was founded by Murugavel Janakiraman in 2001 and is headquartered in Chennai, India.
BREAKOUT LEVEL - 910-930
RSI : 40

Buy MatrimonyMy idea is for educational purpose.
Buy Matrimony @1035 for medium term (1-2 months) target of 1500+


#MATRIMONY Inverted H&S BO above 970#MATRIMONY Inverted H&S BO above 970
1. Inverted H&S BO above 970
2. Accumulate upto 930
3. CBSL 890
4. TARGETs 1057, 1142, 1227, 1348,
1501, 1688+


Matrimony - Multiple patterns, Good HH and LL pattern too#matrimony Awesome movement from this stock from around 670 levels to 950 which was the target earlier thought of...
In current simple Higher High and Lower Low pattern, seems retracing from 0.5 Fib levels.
If shows strength, will enter above 860 with sl 830 -- See previous pattern in related idea.

MATRIMONY: Broke 3yr+ resistance (since IPO) with Volume Spikes!Trendlines are marked on the chart. Go long if closed above trendline with good bullish candle and volume spikes.

Matrimony- 670 to 900 - Perfect Retracement done, Read to Fly!!!#matrimony Shared this on 23rd November when it gave breakout around 670 level and then it touched 914 levels.
Add now and on dips till 800 with SL 780 for - next is 900- 950
Please note - All charts are for educational purpose only.

Matrimony - From 640-670 levels to 830#matrimony shared on 23rd November from 640-670 levels to 830 now and still strong.

Matrimony.com BuyMatrimony.com has supply and demand zones as marked in chart. Near term targets will be 750. Long targets will be 900-950.
This idea is for educational purpose only. Kindly use strict stoploss and Money management rules.
Kindly consult your financial advisor before investing.
Support the idea by hitting 'Like' Button. You can donate coins too.

Matrimony#matrimony shared yesterday, from 675 to 731 today...Check relative idea for yesterday's chart.

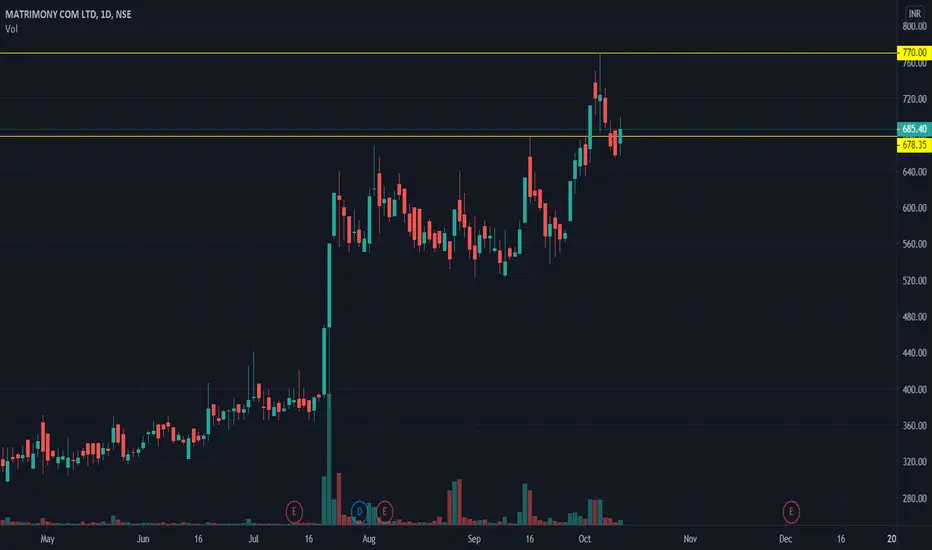
MATRIMONY ASCENDING CHANELMATRIMONY Cmp 692 Buy deep Till 660 for target 734-770-870 Sl Below 600 Closing Basis not surprised if Stock test 4 digit no

Matrimony#matrimony Was watching this since long and finally gave a good breakout with strong volumes... stay bullish here..

MATRIMONY LONGBUY FOR TARGETS OF 773/870/913 STOP LOSS 620. PLEASE MAINTAIN STOP LOSS THIS KIND OF SHARE.

Flag Pattern - super bullish candle - 750 Tgt.Price formed a flag pattern and breaks the flag and reached the pole resistance levels with a strong bullish candle. If this continues tomorrow then price will reach the target of 750 in the coming sessions which is previous resistance level for the script.
