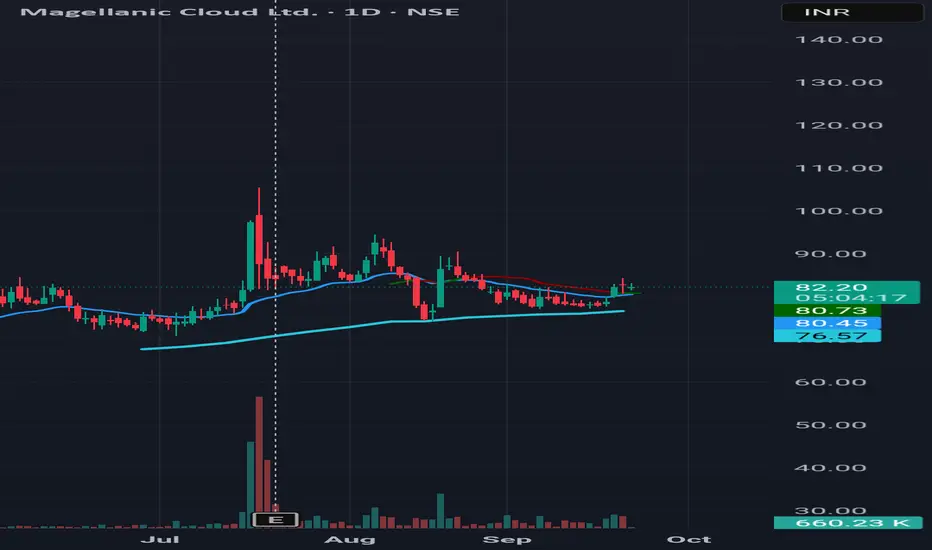
MCloud: The Boring Base Before Big MovesEvery explosive trend starts the same way — in silence.
Price consolidates, volume dies down, and traders get bored.
That’s exactly what’s happening in MCloud.
🔎 Technical
After the July spike, price corrected sharply.
Now price is sitting around ₹80–83, hugging the 200MA.
20 & 50 MAs are fla
3.46 INR
1.03 B INR
5.97 B INR
151.42 M
About Magellanic Cloud Ltd.
Sector
Industry
CEO
Joseph Sudheer Reddy Thumma
Website
Headquarters
Hyderabad
Founded
1981
ISIN
INE613C01026
FIGI
BBG007YY7VZ8
Magellanic Cloud Ltd. operates as a non-banking financial company. The firm engages in the development and design of software application, packages, system and modules either. It also offers technical, management and project consultancy service for development of systems, packages and also undertakes programs for the training of personnel at various locations. The company was founded on December 4, 1981 and is headquartered in Hyderabad, India.
Related stocks
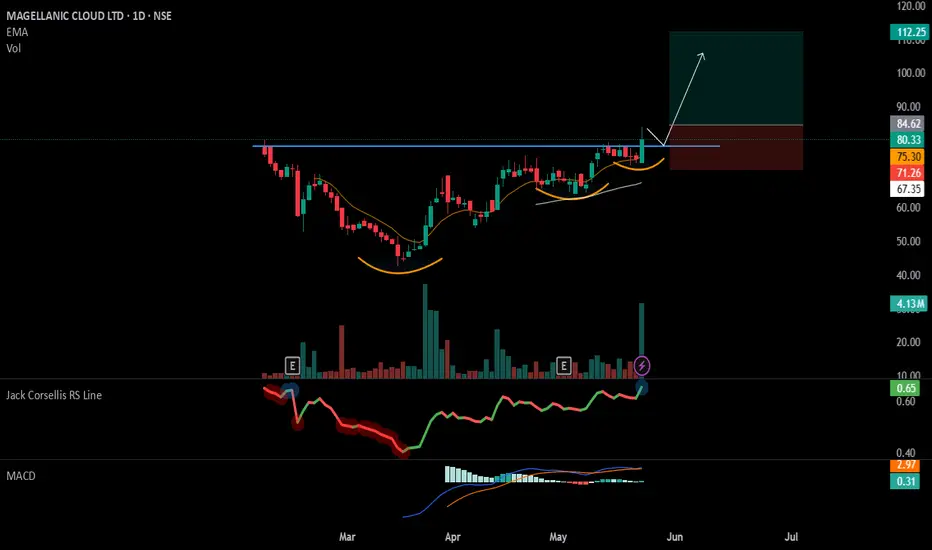
#MCLOUD - VCP + IPO Base Break Out📊 Script: MCLOUD
Key highlights: 💡⚡
📈 VCP + IPO Base BreakOut in Daily Time Frame.
📈 Price consolidated near Resistance.
📈 Volume spike seen
📈 MACD Crossover
📈 Can go for a swing trade
BUY ONLY ABOVE 85 DCB
⏱️ C.M.P 📑💰- 80.33
🟢 Target 🎯🏆 – 31%
⚠️ Stoploss ☠️🚫 – 15%
️⚠️ Important: Market condit
Watch this stock !!!The company provides its IT services in software development, consulting and human resource business solutions i.e. listing employment vacancies and referring or placing applicants for employment. Reported 14% rise in YoY revenue.
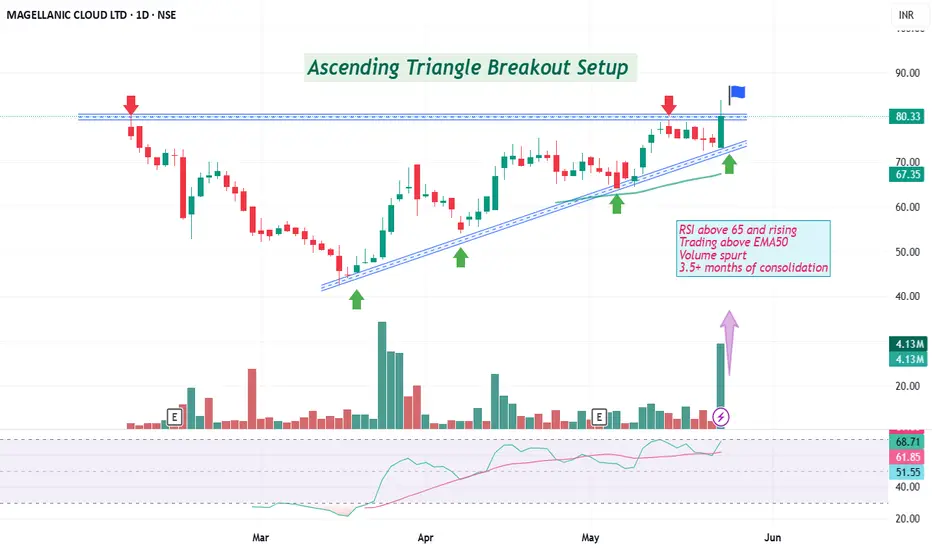
Breakout Screener:
Ascending Triangle Breakout Setup
RSI above 65
BUY TODAY SELL TOMORROW for 5%DON’T HAVE TIME TO MANAGE YOUR TRADES?
- Take BTST trades at 3:25 pm every day
- Try to exit by taking 4-7% profit of each trade
- SL can also be maintained as closing below the low of the breakout candle
Now, why do I prefer BTST over swing trades? The primary reason is that I have observed that


See all ideas
Summarizing what the indicators are suggesting.
Oscillators
Neutral
SellBuy
Strong sellStrong buy
Strong sellSellNeutralBuyStrong buy
Oscillators
Neutral
SellBuy
Strong sellStrong buy
Strong sellSellNeutralBuyStrong buy
Summary
Neutral
SellBuy
Strong sellStrong buy
Strong sellSellNeutralBuyStrong buy
Summary
Neutral
SellBuy
Strong sellStrong buy
Strong sellSellNeutralBuyStrong buy
Summary
Neutral
SellBuy
Strong sellStrong buy
Strong sellSellNeutralBuyStrong buy
Moving Averages
Neutral
SellBuy
Strong sellStrong buy
Strong sellSellNeutralBuyStrong buy
Moving Averages
Neutral
SellBuy
Strong sellStrong buy
Strong sellSellNeutralBuyStrong buy
Displays a symbol's price movements over previous years to identify recurring trends.
Frequently Asked Questions
The current price of MCLOUD is 74.95 INR — it has decreased by −4.83% in the past 24 hours. Watch Magellanic Cloud Ltd. stock price performance more closely on the chart.
Depending on the exchange, the stock ticker may vary. For instance, on BSE exchange Magellanic Cloud Ltd. stocks are traded under the ticker MCLOUD.
MCLOUD stock has fallen by −7.10% compared to the previous week, the month change is a −8.10% fall, over the last year Magellanic Cloud Ltd. has showed a −29.29% decrease.
MCLOUD reached its all-time high on Jul 29, 2024 with the price of 143.20 INR, and its all-time low was 0.21 INR and was reached on Jan 22, 2015. View more price dynamics on MCLOUD chart.
See other stocks reaching their highest and lowest prices.
See other stocks reaching their highest and lowest prices.
MCLOUD stock is 0.88% volatile and has beta coefficient of 1.55. Track Magellanic Cloud Ltd. stock price on the chart and check out the list of the most volatile stocks — is Magellanic Cloud Ltd. there?
Today Magellanic Cloud Ltd. has the market capitalization of 46.21 B, it has increased by 1.00% over the last week.
Yes, you can track Magellanic Cloud Ltd. financials in yearly and quarterly reports right on TradingView.
MCLOUD net income for the last quarter is 277.53 M INR, while the quarter before that showed 223.30 M INR of net income which accounts for 24.29% change. Track more Magellanic Cloud Ltd. financial stats to get the full picture.
Yes, MCLOUD dividends are paid annually. The last dividend per share was 0.03 INR. As of today, Dividend Yield (TTM)% is 0.04%. Tracking Magellanic Cloud Ltd. dividends might help you take more informed decisions.
Magellanic Cloud Ltd. dividend yield was 0.05% in 2024, and payout ratio reached 1.71%. The year before the numbers were 0.03% and 8.53% correspondingly. See high-dividend stocks and find more opportunities for your portfolio.
As of Sep 30, 2025, the company has 314 employees. See our rating of the largest employees — is Magellanic Cloud Ltd. on this list?
EBITDA measures a company's operating performance, its growth signifies an improvement in the efficiency of a company. Magellanic Cloud Ltd. EBITDA is 2.09 B INR, and current EBITDA margin is 34.95%. See more stats in Magellanic Cloud Ltd. financial statements.
Like other stocks, MCLOUD shares are traded on stock exchanges, e.g. Nasdaq, Nyse, Euronext, and the easiest way to buy them is through an online stock broker. To do this, you need to open an account and follow a broker's procedures, then start trading. You can trade Magellanic Cloud Ltd. stock right from TradingView charts — choose your broker and connect to your account.
Investing in stocks requires a comprehensive research: you should carefully study all the available data, e.g. company's financials, related news, and its technical analysis. So Magellanic Cloud Ltd. technincal analysis shows the sell today, and its 1 week rating is sell. Since market conditions are prone to changes, it's worth looking a bit further into the future — according to the 1 month rating Magellanic Cloud Ltd. stock shows the sell signal. See more of Magellanic Cloud Ltd. technicals for a more comprehensive analysis.
If you're still not sure, try looking for inspiration in our curated watchlists.
If you're still not sure, try looking for inspiration in our curated watchlists.