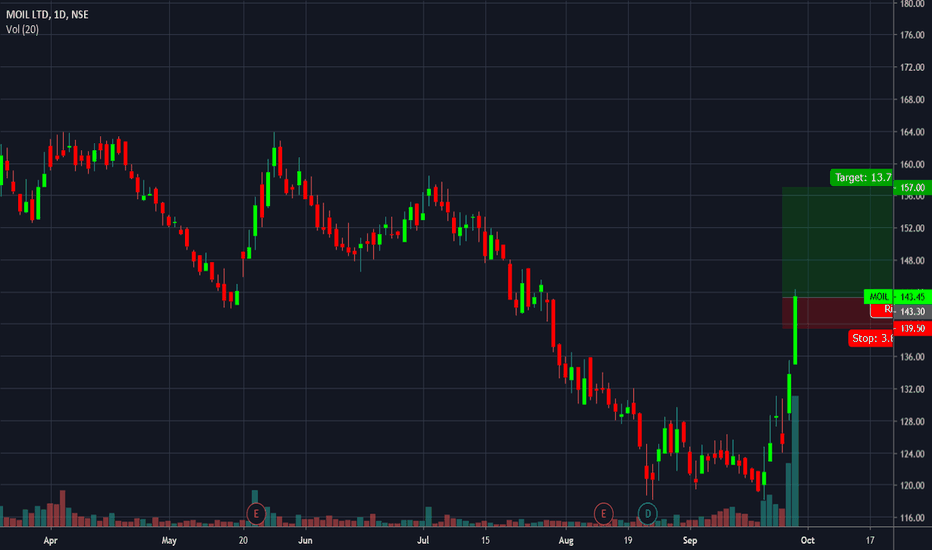
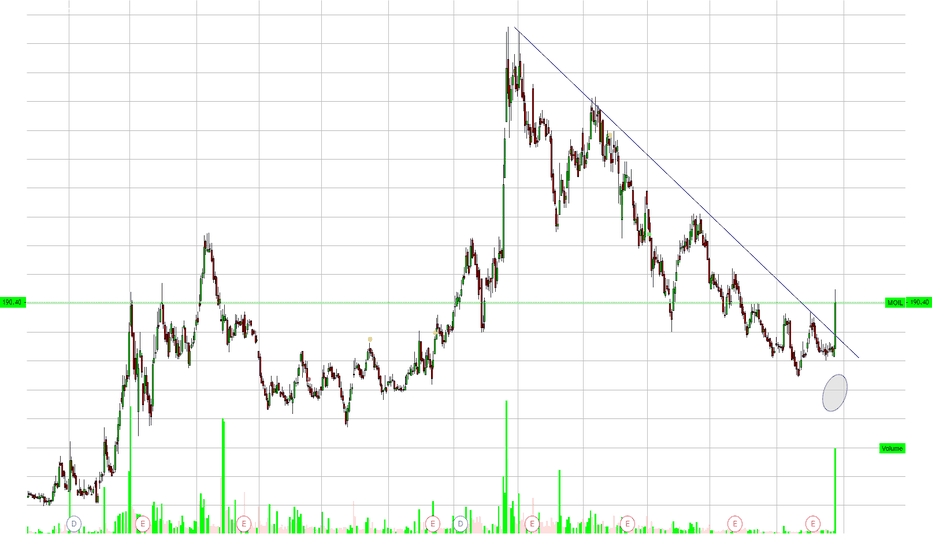
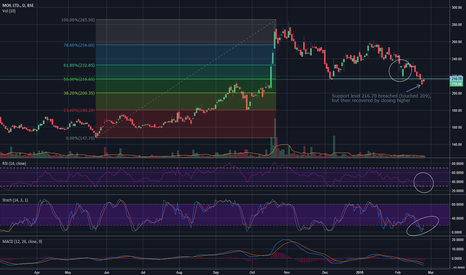
Moil : Wait for close above 165MOIL is trading in parallel channel. Breakout will be above 160 but we'll wait for daily close above 165 to confirm reversal and formation of higher top. Above 165 target would be 200 with SL below 150 . RSI and CCI is confirming direction of the trend.Longby UnknownUnicorn42605590
#MOILClose > 186.15 needed for a climb Probably that will get the momentum activatedby krishnakhanna1
#MOILFibo 61.8 crossed with strength Next the bounce from the same level Momentum is missing on all TFby krishnakhanna0
MOILThis performed well when all the other stocks fell found support at weekly 200MA and closed above 23.6% fib retracement levels on daily chart tenkan went below 50MA and kijun future kumo negative overall bearish but may test tenkan and 38.2% fib levels to the upside show below 165 levels long above 168 levels check on a lower time frame(5min) how well it holds the levels before placing a tradeLongby avito123Updated 0
MOILRounded Bottom Pattern formed in a downtrend. Waiting for the charts to close above 200. Disclaimer: I am a novice in the markets, so please don't construe your trade basis this chart. I post it to see if my views holds true. Longby Nikita_Poojary0
Moil Long - Strong Trend!Go long don't follow stop loss strictly, if market remains strong.Longby a15pUpdated 0
Based on Elliot study, Targets and SL have been mentionedEverything is mentioned in Chart.Longby MeetShah0f2
Formation of left shoulder in inverse H&SThe trend seems to be forming a inverse H&S (see circle - marks what looks like a left shoulder) Additional bullish evidence: RSI is rising Stochastic showing bullish 50% Fibonacci retracement is complete For better confirmation must wait for 2-3 days more to confirm bullish trendLongby nileshgr1
MOIL symmetric triangle (study purpose only)MOIL symmetric triangle (study purpose only)by k314Updated 11
MOIL Ltd Cup With Handle Pattern!Technical : Cup With Handle Pattern Breakout Confirm! technical Target : 323 Fundamentals Good : (Fundamental Medium Term Target 700) (Fundamental Long Term Target 900) 1.Total (Mkt. Cap) : 6418cr 2.Zero Debt : 0.00 cr 3. Stock PE : 10.45 Longby sagar.potekar.72
moil looks bullish in short termIn daily, price bounced with good volume after testing the support level, also hidden bullish divergence formed here, with sl - 205, tgt - 280 Longby ParamjitMahapatroUpdated 4
Accumulate MOILAccumulate MOIL for targets 270 and 300 of in the long term and keep SL of 200 on weekly close basis.Longby raghu.972Updated 1
MOIL : Expansion in process..MOIL has given a breakout in weekly charts & today it has crossed crucial resistance. Buy into this strength at CMP of 383, SL - 361, for targets of 419.Longby rahul.u.bhagwat0
MOIL Adding Strength With Reverse “Heads & Shoulders”Targets : 410-420 Buy Range : Above 356 Stoploss : 319 Duration : 2-3 months Outlook : Current chart structure of MOIL a participant from Mining & Minerals sector suggest a potential “ Inverted Heads & Shoulders pattern setup on the 3 line break charts. This pattern is a reversal pattern signaling a bottom as it occurs following a downtrend. As the pattern contains three successive troughs with the middle trough (Head 296.65 levels ) being the deepest and the two outside troughs ( Shoulders Left 306.80 & Right 318.40) being shallower. However it is advisable to wait the till the bar closes above the neckline ( 355 levels ). Recent price pattern also resulted a breakout from a “downward sloping trendline (black coloured line) with surge in volumes and since the breakout is on higher side, we expect the prices heading towards north. Moreover, Stock has already witnessed a “3 line Break” and all set to head higher Three Line Break, denotes a stronger move that can signal a trend reversal. A bullish trend reversal occurs when three black lines form and a single white line breaks the high of these three lines. Bollinger bandwidth suggests that a squeeze has ended and a breakout above the upper band has happened which is a positive signal.Stock is trading above its short, medium and longer term moving averages , 14 period RSI suggest a strong upmove going forward for the stock. Keeping in mind, the above technical observations, we suggest a Buy in this particular stock as per levels mentioned above. Longby BHUMIT-ARQ0
MOIL- Inverted Head n ShoulderA beautiful Inverted Head n Shoulder is seen in the downtrend. Sustaining above present levels of 346-347 may confirm the breakout of the pattern.by harrie0074
MOIL Multiple Harmonics.MOIL: @ 307.25 Multiple HARMONIC Pattern One after One. Last ONE Bullish BUTTERFLY . Failed two times to Enter ICHIMOKU Cloud. Third Attempt on the Way. Though in between attempts Upper Band of Cloud Dip to Recent High @ 338 compare to Previous TWO @ 376.5, @ 363.9 respectively. Hence much easy to Cross Above ICHIMOKU Cloud. Best ENTRY Level @ 301 - @ 296. TGT: @ 312.8, @ 324.3 , @ 334, @ 343.5 , @ 357, @ 367 -382 . Weak Below @ 291,(if Closed two Consecutive Day.) More Accumulation Level @ 282 Longby sankarghatak1
good investmentMOIL on daily charts looks good for investment. Follow the stop loss of 300. Longby raghu.972Updated 3
Again giving views on MOILMOIL Looks good for Investment. Created a Higher Low. Buy 70% now, 30% on dips till 290 SL 270 Target 370/430/500Longby Singh_SiddzUpdated 336