BUY TODAY SELL TOMORROW for 5%DON’T HAVE TIME TO MANAGE YOUR TRADES?
- Take BTST trades at 3:25 pm every day
- Try to exit by taking 4-7% profit of each trade
- SL can also be maintained as closing below the low of the breakout candle
Now, why do I prefer BTST over swing trades? The primary reason is that I have observed that
2.10 INR
334.64 M INR
4.67 B INR
94.45 M
About Moschip Technologies Ltd
Sector
Industry
CEO
Srinivasa Rao Kakumanu
Website
Headquarters
Hyderabad
Founded
1999
ISIN
INE935B01025
FIGI
BBG000CTZKK7
Moschip Technologies Ltd. engages in the development and manufacture of semiconductor and system design solutions. It operates through the Semiconductor Services and Products; and Internet on Things (IOT) Business segments. The Semiconductor Services and Products segment focuses on electronics devices, medical electronics, and military systems. The IOT Business segment refers to technologies and applications that equip sensors and devices to generate information, connect to internet, and communicate to computing source for data analysis. The company was founded by Kadiri Ramachandra Reddy on July 27, 1999 and is headquartered in Hyderabad, India.
Related stocks
MOSCHIP: IPO Breakout & Pocket Pivot Leads to Volume SurgMOSCHIP has staged a powerful breakout above its IPO base following a sustained period of consolidation and a well-defined pocket pivot, supported by a sharp surge in trading volume. This move above previous resistance suggests strong accumulation and potential for continuation, reinforced by bullis

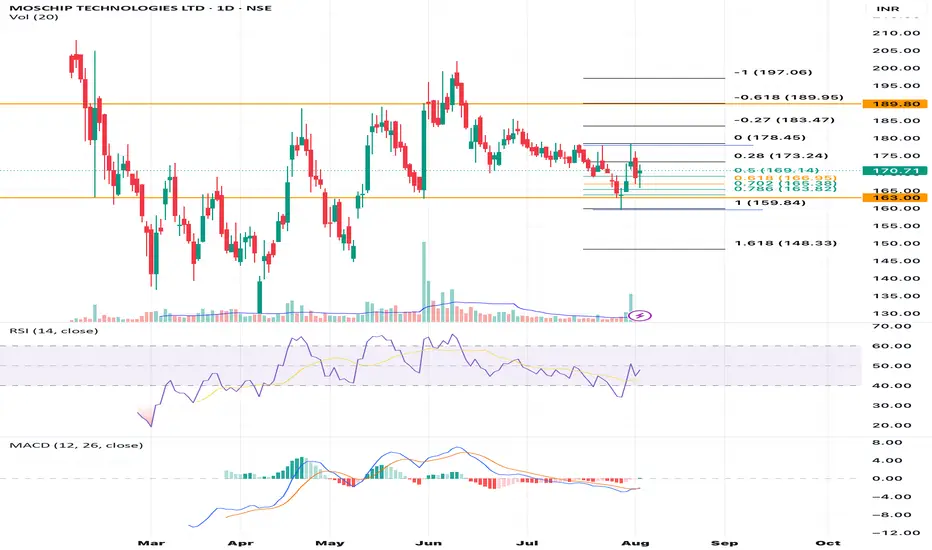
Technical analysis of the MOSCHIP TECHNOLOGIES LTDHere’s a technical analysis of the MOSCHIP TECHNOLOGIES LTD (NSE: MOSCHIP) daily chart using the visible price action, Fibonacci retracement levels, RSI, MACD, and volume:
⸻
🔍 Price Action & Fibonacci Levels
• Current Price: ₹170.71 (+1.22%)
• Price is at/near the 0.618 Fibonacci retracement lev
Moschip Technologies - Confluence ReistanceMoschip :
Approaching Strong Resistance Confluence currently
Need to sustain 190 levels for possible all time highs
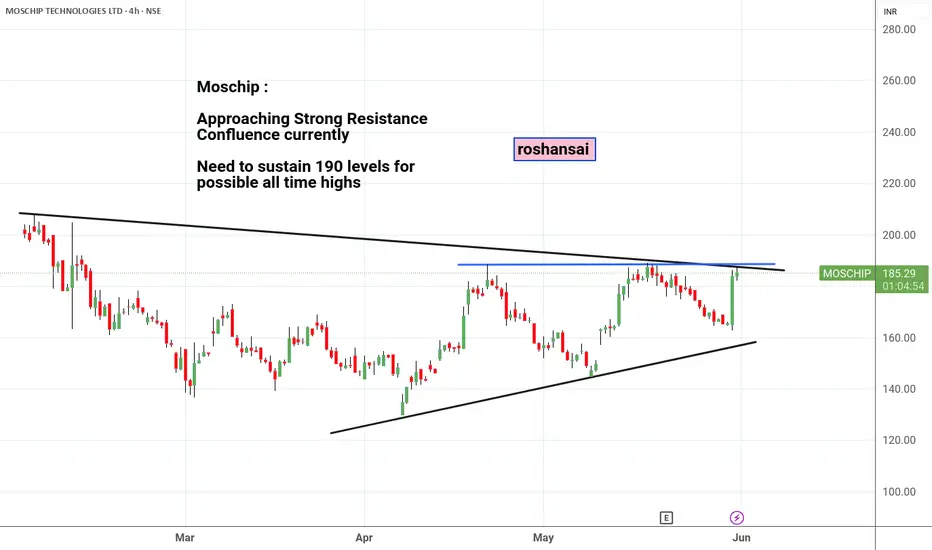
Setting up nicely + Good base formation with volume
+ spending time at the resistance
+ Above Key EMAs
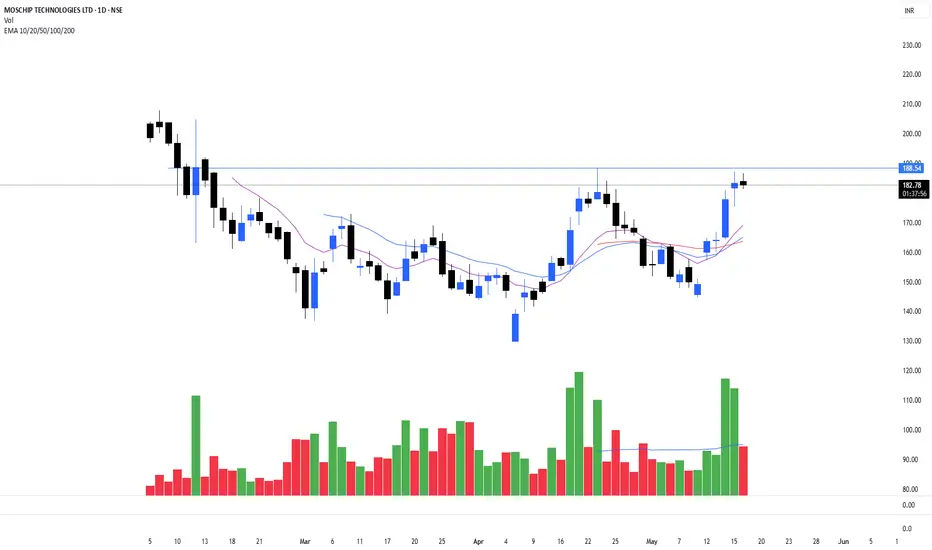
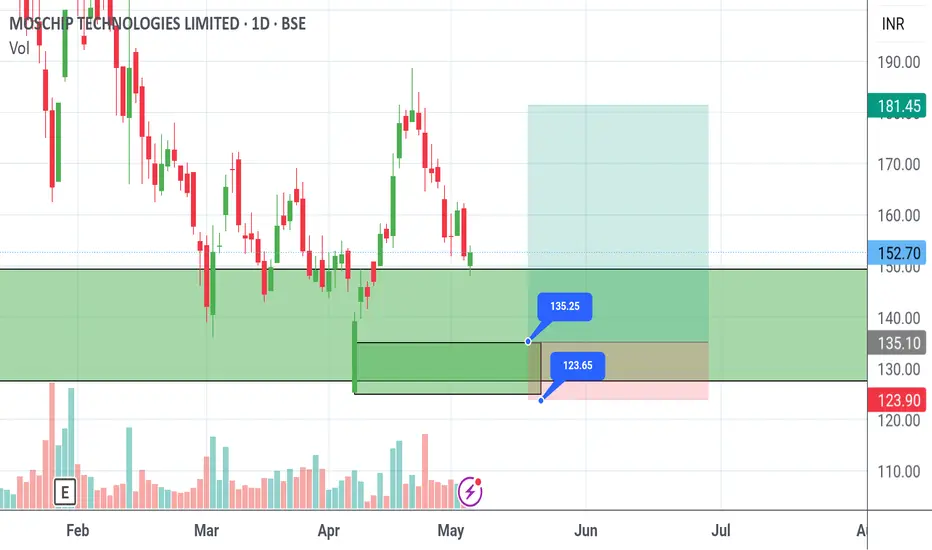
Moschip Buy ZoneEntry and exit are marked.
Risk reward = 1:4
If stoploss hits and you get a chance to re-enter the trade again then take only 1 to 2% risk.
Moshchip Technologies Buy ZoneEntry and exit are marked.
Risk reward = 1:4
If stoploss hits and you get a chance to re-enter the trade then play it with only 1 to 2 % risk.

moship flag and polestock has been more 100 % move in recent times it is expected to give good momentum as it breaks this trendline

MosChip Technologies Bullish Flag PatternCurrent Price: 268.25 INR
The stock experienced a significant upward move followed by a consolidation phase.
The stock seems to be forming a Bullish Flag pattern
Moving Averages
MACD Indicator:
The MACD line (blue) is below the signal line (orange), indicating bearish momentum.
The histogram i

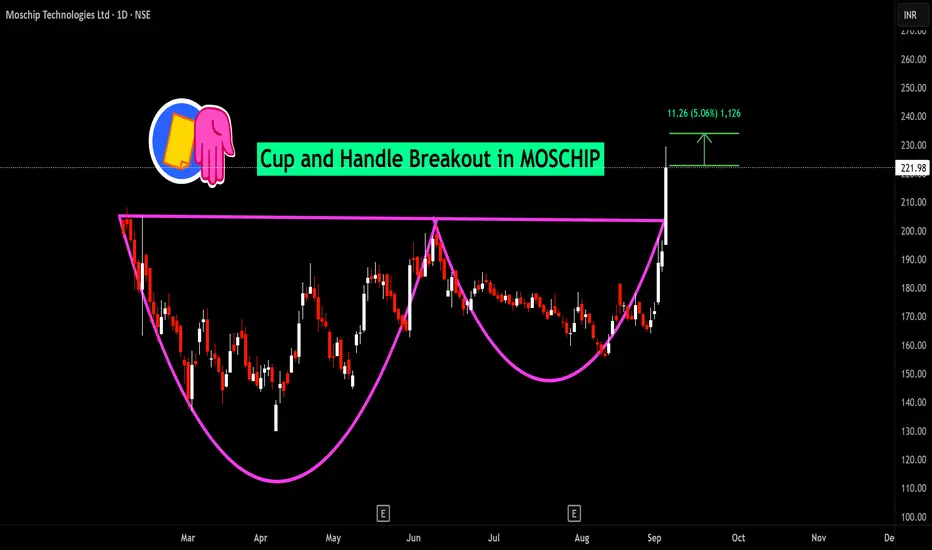
Recommendation on MosChip Technologies This is forming a cup and handle pattern, advisable to buy this stock
T1 - 104
T2 - 110
T3 - 120

See all ideas
Summarizing what the indicators are suggesting.
Oscillators
Neutral
SellBuy
Strong sellStrong buy
Strong sellSellNeutralBuyStrong buy
Oscillators
Neutral
SellBuy
Strong sellStrong buy
Strong sellSellNeutralBuyStrong buy
Summary
Neutral
SellBuy
Strong sellStrong buy
Strong sellSellNeutralBuyStrong buy
Summary
Neutral
SellBuy
Strong sellStrong buy
Strong sellSellNeutralBuyStrong buy
Summary
Neutral
SellBuy
Strong sellStrong buy
Strong sellSellNeutralBuyStrong buy
Moving Averages
Neutral
SellBuy
Strong sellStrong buy
Strong sellSellNeutralBuyStrong buy
Moving Averages
Neutral
SellBuy
Strong sellStrong buy
Strong sellSellNeutralBuyStrong buy
Displays a symbol's price movements over previous years to identify recurring trends.
Frequently Asked Questions
The current price of MOSCHIP is 255.90 INR — it has increased by 0.67% in the past 24 hours. Watch Moschip Technologies Ltd stock price performance more closely on the chart.
Depending on the exchange, the stock ticker may vary. For instance, on BSE exchange Moschip Technologies Ltd stocks are traded under the ticker MOSCHIP.
MOSCHIP stock has risen by 10.56% compared to the previous week, the month change is a 55.85% rise, over the last year Moschip Technologies Ltd has showed a 0.35% increase.
MOSCHIP reached its all-time high on Jun 25, 2024 with the price of 326.80 INR, and its all-time low was 1.30 INR and was reached on Sep 5, 2013. View more price dynamics on MOSCHIP chart.
See other stocks reaching their highest and lowest prices.
See other stocks reaching their highest and lowest prices.
MOSCHIP stock is 4.60% volatile and has beta coefficient of 2.37. Track Moschip Technologies Ltd stock price on the chart and check out the list of the most volatile stocks — is Moschip Technologies Ltd there?
Today Moschip Technologies Ltd has the market capitalization of 49.14 B, it has decreased by −1.43% over the last week.
Yes, you can track Moschip Technologies Ltd financials in yearly and quarterly reports right on TradingView.
MOSCHIP net income for the last quarter is 108.98 M INR, while the quarter before that showed 86.91 M INR of net income which accounts for 25.40% change. Track more Moschip Technologies Ltd financial stats to get the full picture.
No, MOSCHIP doesn't pay any dividends to its shareholders. But don't worry, we've prepared a list of high-dividend stocks for you.
EBITDA measures a company's operating performance, its growth signifies an improvement in the efficiency of a company. Moschip Technologies Ltd EBITDA is 637.33 M INR, and current EBITDA margin is 12.02%. See more stats in Moschip Technologies Ltd financial statements.
Like other stocks, MOSCHIP shares are traded on stock exchanges, e.g. Nasdaq, Nyse, Euronext, and the easiest way to buy them is through an online stock broker. To do this, you need to open an account and follow a broker's procedures, then start trading. You can trade Moschip Technologies Ltd stock right from TradingView charts — choose your broker and connect to your account.
Investing in stocks requires a comprehensive research: you should carefully study all the available data, e.g. company's financials, related news, and its technical analysis. So Moschip Technologies Ltd technincal analysis shows the buy rating today, and its 1 week rating is strong buy. Since market conditions are prone to changes, it's worth looking a bit further into the future — according to the 1 month rating Moschip Technologies Ltd stock shows the strong buy signal. See more of Moschip Technologies Ltd technicals for a more comprehensive analysis.
If you're still not sure, try looking for inspiration in our curated watchlists.
If you're still not sure, try looking for inspiration in our curated watchlists.