Trade ideas
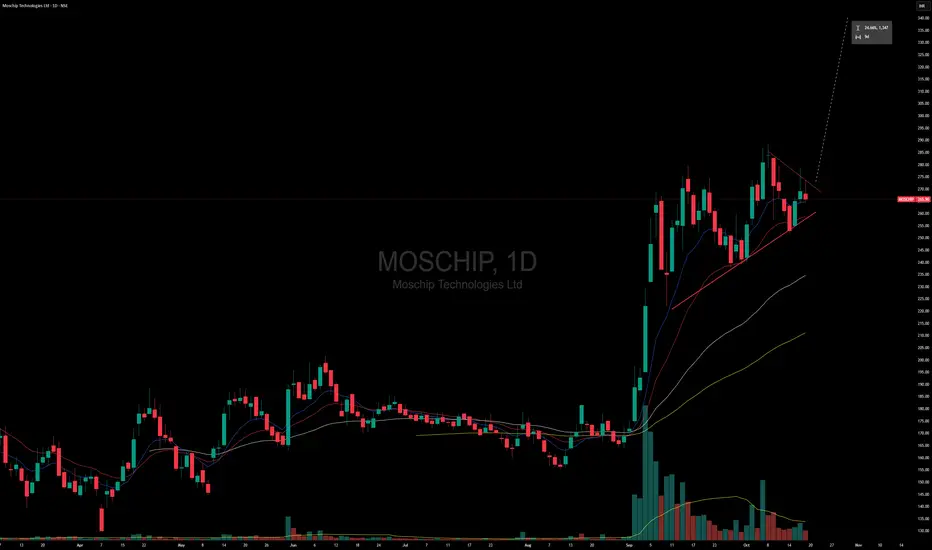
Moschip Technologies: Breakout at 277.Moschip Technologies: Breakout at 277. CMP 270.
Resistance 320
Support 241
Semiconductor Sector Tailwinds

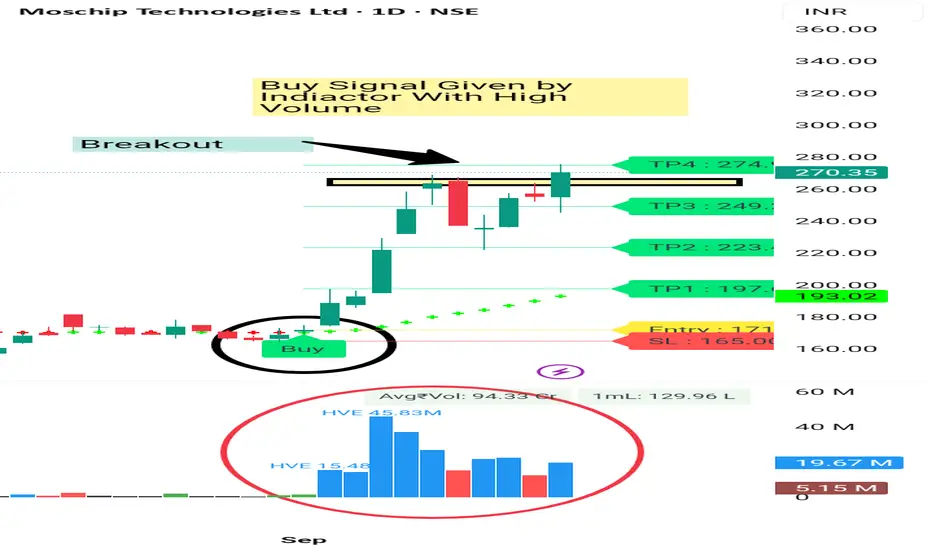
Moschip Technologies:Price Action & Semiconductor Push TailwindsRecent listing ( Feb 2025) of Moschip Technologies broke out from the IPO high price in early September with very good volume. Post breakout the stock moved from 200 to 270 real quick.
The stock was consolidating in a downward sloping channel. Since last two days the stock came out of the downward sloping channel with increase in the volume.
If the stock holds 240 levels, then it can demonstrate an up move till 320 levels in short term.
BUY TODAY SELL TOMORROW for 5%DON’T HAVE TIME TO MANAGE YOUR TRADES?
- Take BTST trades at 3:25 pm every day
- Try to exit by taking 4-7% profit of each trade
- SL can also be maintained as closing below the low of the breakout candle
Now, why do I prefer BTST over swing trades? The primary reason is that I have observed that 90% of the stocks give most of the movement in just 1-2 days and the rest of the time they either consolidate or fall
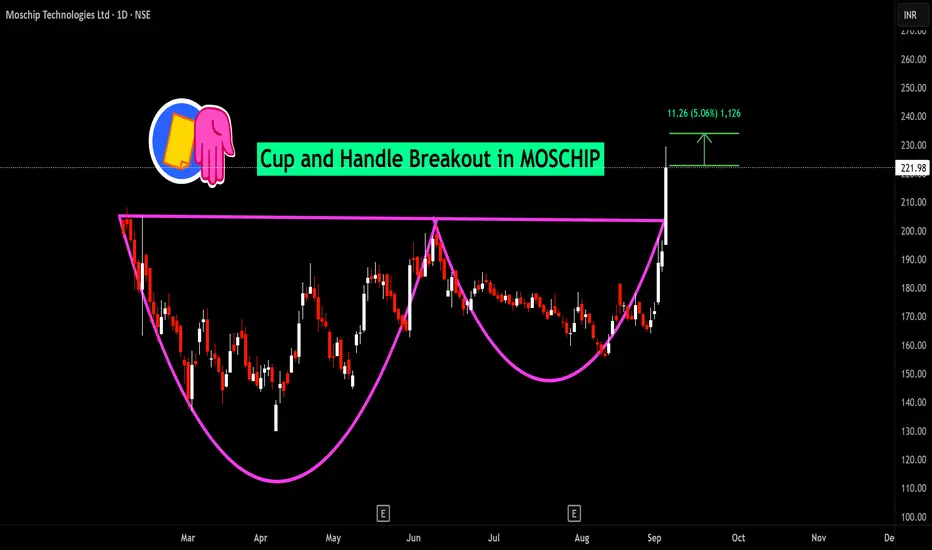
Cup and Handle Breakout in MOSCHIP
BUY TODAY SELL TOMORROW for 5%
MOSCHIP BREAKOUT with Heavy Volume moschip is Given Decent Movement in past with High Volume. And now it's given good Breakout with Bullish Englulfing Candle. It's a Clear Breakout and it can give 5 -8% Quick movement from here . Keep SL 5%
Consult your financial advisor before making any position in stock market.
For More information. Visit my Tradingview Profile.
Always Trade with Stoploss.
moschipit is forming cup and handle and facing resistance at all time high level.
if we are able to get monthly closing then we may expect BO level retest and then it may act as good support.
high hopes

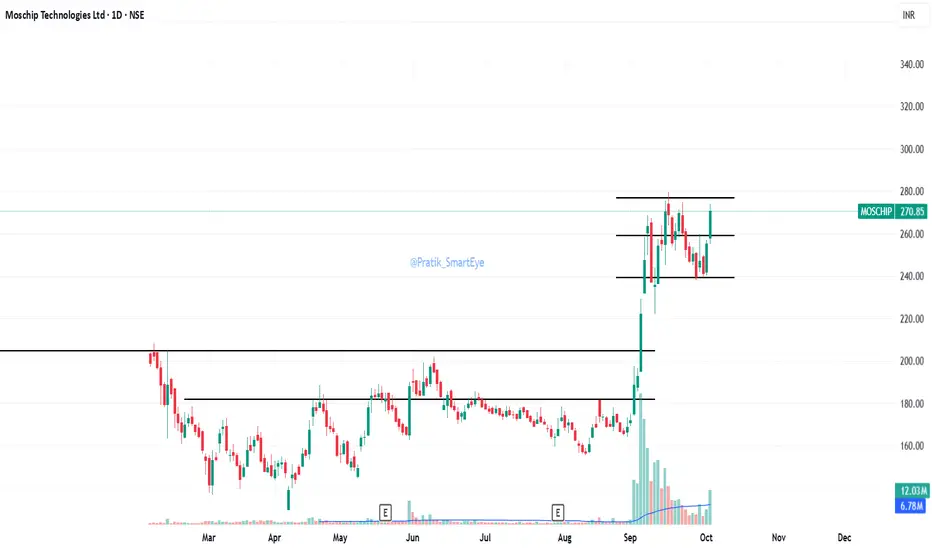
MOSCHIP: IPO Breakout & Pocket Pivot Leads to Volume SurgMOSCHIP has staged a powerful breakout above its IPO base following a sustained period of consolidation and a well-defined pocket pivot, supported by a sharp surge in trading volume. This move above previous resistance suggests strong accumulation and potential for continuation, reinforced by bullish momentum in short-term moving averages. Traders may watch for follow-through above ₹222, provided volume confirms institutional interest and broader market conditions remain favorabl

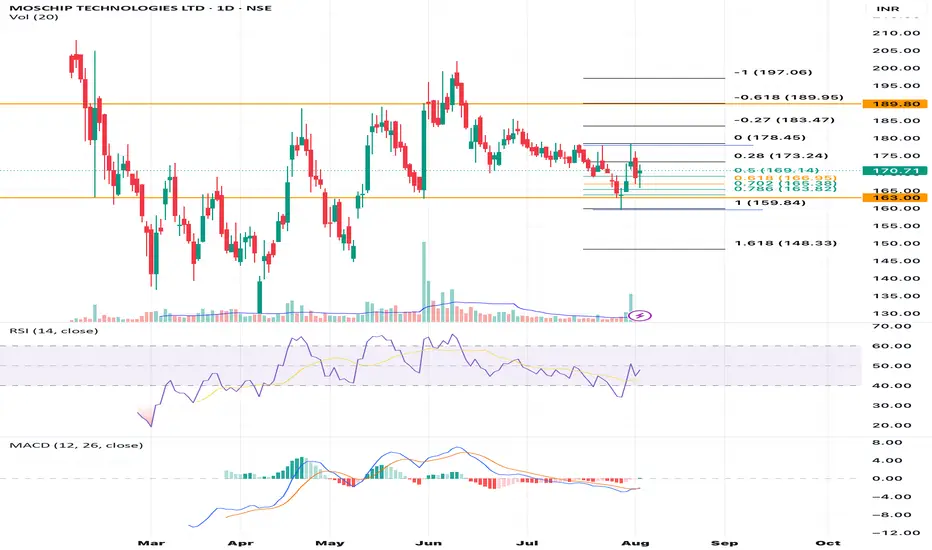
Technical analysis of the MOSCHIP TECHNOLOGIES LTDHere’s a technical analysis of the MOSCHIP TECHNOLOGIES LTD (NSE: MOSCHIP) daily chart using the visible price action, Fibonacci retracement levels, RSI, MACD, and volume:
⸻
🔍 Price Action & Fibonacci Levels
• Current Price: ₹170.71 (+1.22%)
• Price is at/near the 0.618 Fibonacci retracement level (~₹170.14), which often acts as a strong support/resistance.
• The price recently bounced off the ₹163.00 support zone (1.0 Fib), showing buying interest.
• Resistance levels ahead:
• ₹173.24 (0.28 Fib)
• ₹178.45 (0.0 Fib)
• ₹183.47 (-0.27 Fib)
• ₹189.80 (-0.618 Fib) — a major resistance zone.
⸻
📊 Volume Analysis
• A noticeable volume spike on the latest candle suggests strong participation (possibly institutional), indicating a potential short-term trend reversal or breakout.
⸻
💹 RSI (Relative Strength Index)
• RSI is around 50, indicating neutral momentum.
• It has bounced from below 40 recently, suggesting emerging bullish momentum.
• Not yet overbought — room for further upside if momentum continues.
⸻
📉 MACD (Moving Average Convergence Divergence)
• MACD and Signal Line are still below the zero line, indicating the overall trend is still bearish.
• However, the histogram is showing reducing bearish momentum (bars are getting shorter).
• A bullish crossover may be forming soon, which would support a further upward move.
⸻
📈 Summary & Outlook
Bullish Signs:
• Price rebounded from strong support at ₹163.
• Volume spike on up day — signs of accumulation.
• RSI is recovering.
• Possible bullish MACD crossover coming.
Bearish/Risk Factors:
• Price still under key resistance levels (₹173.24 & ₹178.45).
• MACD is still in bearish territory.
• Market may retest support if it fails to break ₹173-175 decisively.
⸻
🔔 Key Levels to Watch:
• Support: ₹163.00 / ₹160.14
• Resistance: ₹173.24 → ₹178.45 → ₹183.47 → ₹189.80
⸻
📝 Strategy Suggestion (Not Financial Advice):
• Bullish Bias above ₹170 with target at ₹173.24 → ₹178.45.
• Watch for breakout above ₹178.45 with strong volume for momentum trade.
• Stop-loss below ₹163 for swing trades.
Moschip Technologies - Confluence ReistanceMoschip :
Approaching Strong Resistance Confluence currently
Need to sustain 190 levels for possible all time highs
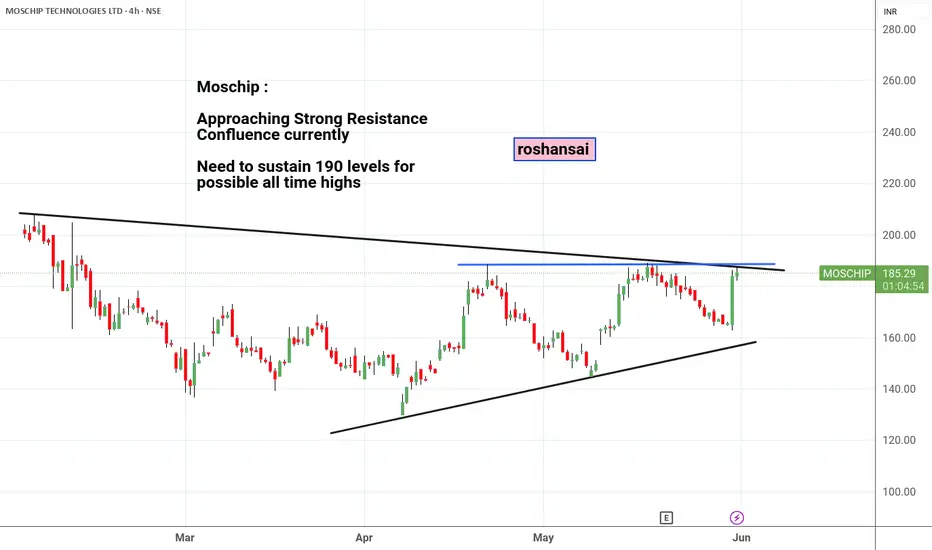
Setting up nicely + Good base formation with volume
+ spending time at the resistance
+ Above Key EMAs
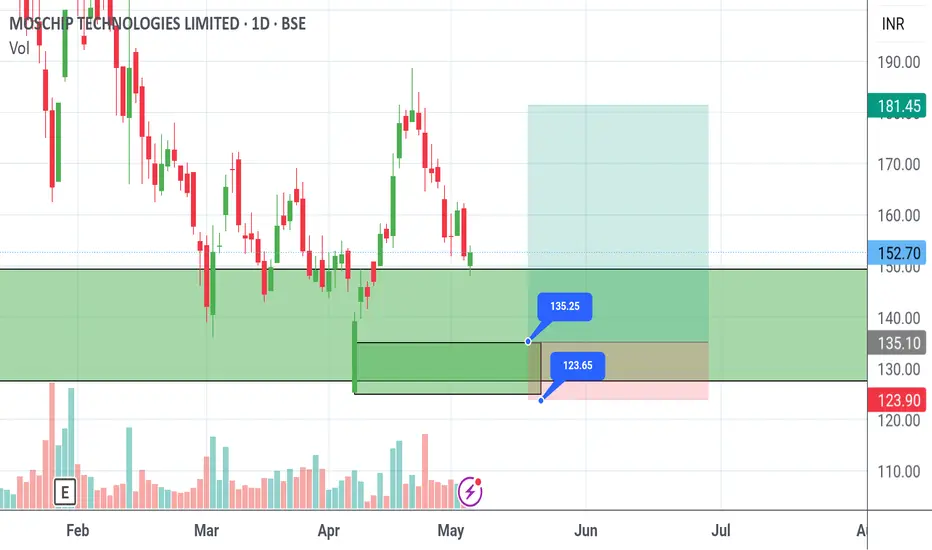
Moschip Buy ZoneEntry and exit are marked.
Risk reward = 1:4
If stoploss hits and you get a chance to re-enter the trade again then take only 1 to 2% risk.
Moshchip Technologies Buy ZoneEntry and exit are marked.
Risk reward = 1:4
If stoploss hits and you get a chance to re-enter the trade then play it with only 1 to 2 % risk.

moship flag and polestock has been more 100 % move in recent times it is expected to give good momentum as it breaks this trendline

MosChip Technologies Bullish Flag PatternCurrent Price: 268.25 INR
The stock experienced a significant upward move followed by a consolidation phase.
The stock seems to be forming a Bullish Flag pattern
Moving Averages
MACD Indicator:
The MACD line (blue) is below the signal line (orange), indicating bearish momentum.
The histogram is also negative, which reinforces the bearish sentiment.
RSI Indicator:
Currently, the RSI is around 51.01, indicating neutral territory.
It previously showed an overbought condition when the stock peaked, and now it's cooling down.
Patterns and Key Levels
Support and Resistance Levels
Immediate Support: Around 265 INR
This is derived from the recent low.
Immediate Resistance: Around 280-285 INR
This is from the recent high during the consolidation phase.
Stock market analysis involves risk, and it's essential to use this information for educational purposes only. Always conduct your own research or consult with a financial advisor before making any investment decisions.

Recommendation on MosChip Technologies This is forming a cup and handle pattern, advisable to buy this stock
T1 - 104
T2 - 110
T3 - 120

Moschip - Good Semiconductor stock- Good above 260Moschip - Buy Between 280 to 170.
Targets 417/666
SL-126
Disclaimer : Educational Content. Do your own research !!

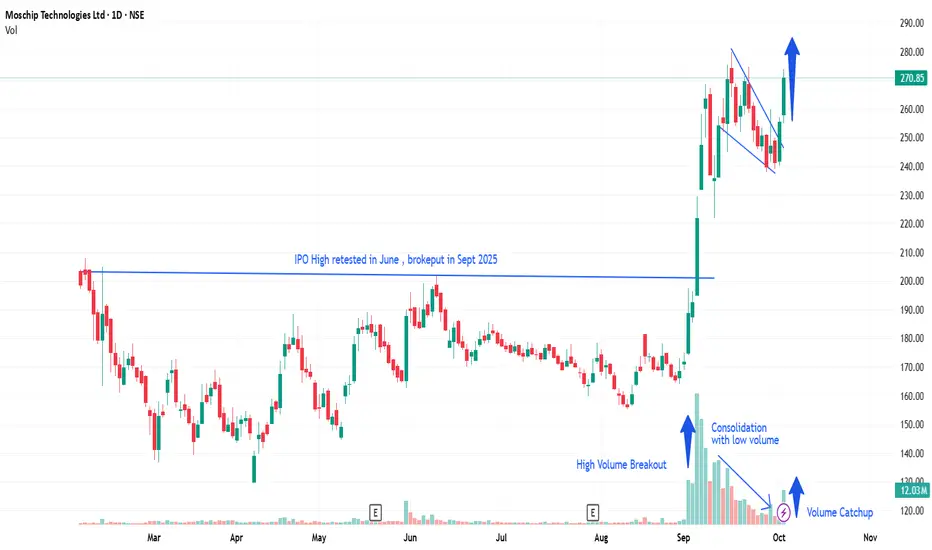
MOSCHIP - BREAKING OUT OF THE PATTERNBreaking out of the channel with supported volume
Huge sector tailwind behind Semiconductor manufacturing in India

Bullish Outlook: MOSCHIP Above 120 Signals Potential Bull RunDetails:Asset: MOSCHIP Technology (MOSCHIP)Breakout Level: Above 120Potential Targets: Projection based on technical analysis and market sentimentStop Loss: Below breakout level or as per risk toleranceTimeframe: Medium to long-termRationale: MOSCHIP, a semiconductor stock, is poised for a potential bull run with a breakout anticipated above the 120 level. The company stands to benefit from growing domestic demands for semiconductors, which are essential components in various electronic devices. With increasing competition among semiconductor manufacturers, MOSCHIP's focus on domestic needs presents an opportunity for significant growth and market penetration.Market Analysis:Growing Domestic Needs: MOSCHIP's alignment with the growing domestic demand for semiconductors positions it favorably in the market.Competitive Advantage: The company's focus on competing with larger players in the semiconductor industry, especially in sectors beyond household electronics, enhances its potential for growth and profitability.Potential Bull Run:Market Sentiment: Positive market sentiment towards semiconductor stocks and MOSCHIP's strategic positioning could catalyze a bull run.Sector Growth: Favorable industry trends and increasing demand for semiconductors may contribute to MOSCHIP's upward trajectory.Risk-Reward Ratio: Consider individual risk tolerance and implement appropriate risk management strategies.As with any investment opportunity, it's essential to conduct thorough research and monitor market developments closely.

Looking to long MoschipBSE:MOSCHIP Near high contracting making higher low and downside volume is drying up
chances of this going lower is low

#MOSCHIP (Weekly)⚡️Low Debt
⚡️ATH Breakout expected
⚡️Volume rising
⚡️Closed above Fibo 0.5 level of downfall
⚡️Momentum expected above 100
🔴 SL 95
🟡 CMP 99
🟢 TGT 109/124/149

BREAKOUT, MOSCHIP TECH, 62% RETURNS!!!BUY - MOSCHIP TECH
CMP - Rs. 92
Target - 1: Rs. 126
Target - 2: Rs. 150
.
Timeframe - 4 - 8 months
.
Technicals - Bullish Triangle Breakout
.
This is just a view by an expert analyst, please invest at your own risk.
.
Follow me for more!

moschip 1w bse ascending triangle pattern buy target 84, 88moschip 1w bse ascending triangle pattern
buy target 84, 88, 93.75
risk reward 2
sl 64.50
this is just a view trade at your own risk
