Bullish on MOTILAL OSWAL for Long TermAfter reaching an ATH of 1588.40 in Jan'18, MOTILALOFS corrected by approx 73% to reach a low of 426 in Mar '20, followed by an upward journey to 1188 and then corrected. In the process it formed a falling wedge pattern.
The scrip broke out of the wedge pattern in the month of Oct'23 rising 33% in last two months.
MOTILALOFS trade ideas

Breakout of all time highGood volume buildup in daily and weekly timeframe.
All time high breakout with good volume buildup after some consolidation.
Earning report in few days, if in favor can give good movement.
NOTE: i do my analysis, do yours before trade.

MotilalOFS Bullish Flag Breakout - Potential for Further Upside MotilalOFS appears to be forming a bullish flag pattern on the chart, indicating a potential continuation of its upward momentum. The stock has shown strength by maintaining levels above 2120, suggesting bullish sentiment in the market.
Key Points:
Bullish Flag Formation: MotilalOFS is displaying a classic bullish flag pattern, characterized by a sharp upward move (flagpole) followed by a consolidation phase (flag) in the form of a downward sloping channel.
Sustaining Above 2120: The stock has managed to sustain levels above 2120, which acts as a critical support-turned-resistance level. This indicates strong buying interest and a potential shift in sentiment towards the bullish side.
Potential Breakout: A sustained move above the upper boundary of the flag pattern, accompanied by increasing volume, could trigger a breakout, signaling the resumption of the prior uptrend.
Target Levels: If the breakout occurs, the next resistance levels to watch for are at . Traders may consider setting their profit targets accordingly.
Risk Management: As with any trading setup, it's essential to implement proper risk management techniques. Consider placing stop-loss orders below key support levels to protect against adverse price movements.
Confirmation: Traders should wait for confirmation of the breakout before initiating any trades. This could include a strong close above the flag pattern or a surge in volume confirming the upward momentum.
Disclaimer: This is not financial advice. Trading involves risk, and individuals should conduct their own research or consult with a financial advisor before making any investment decisions.
Keep an eye on MotilalOFS as it approaches the potential breakout point, as it may present an opportunity for traders to capitalize on the anticipated bullish move.

MOTILAL OSWAL READY TO RETESTThe stock has given a breakout from rounding bottom pattern breaking a major resistance of 1590 it is expected to touch this level again and than rally thereafter
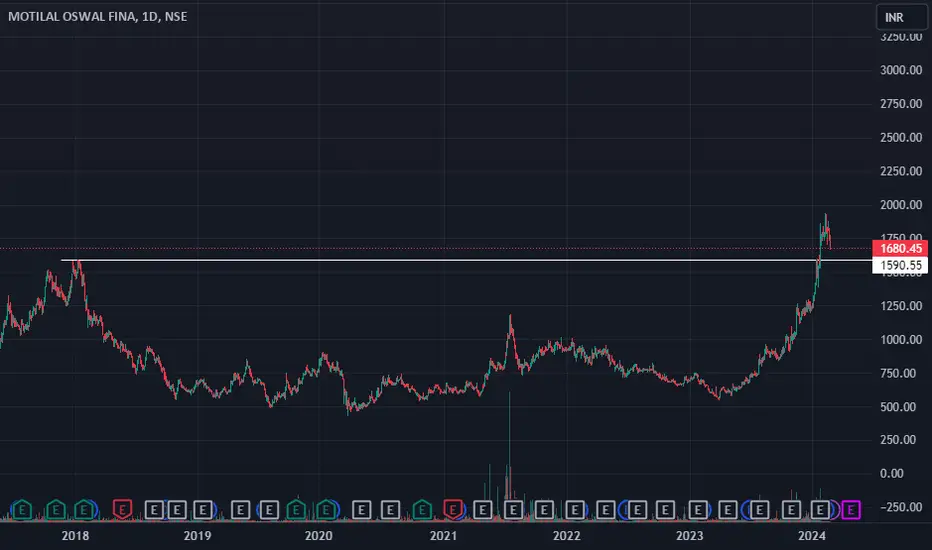

MOSL MULTI YR BREAKOUTMOSL (W), MOTILAL OSWAL given multi yr breakout above 1650 with price volume. Next level to look for 1860/1920/2000 minimum. View invalid if falls below 1550 on weekly closing.

Motilal Oswal - Long term BreakoutMotilal Oswal has given a massive breakout of year 2017 on daily chart. This stock has given almost 80% return in year 2023 and around 30% return in last one month.
This breakout is all time high for this stock and entered in blue sky zone where there is no resistance upside. Generally stocks gives huge returns after all time high breakout. The possible targets from here can be found using Fibonacci retrenchment.
Disclaimer: Stock shared for educational purpose and not a buy or sell recommendations

MOTILALOFS (Breakout with Good Volume)MOTILALOFS
.
TF-1M
.
Done Volume breakout & retest.
.
Levels are given on chart.
.
(If it closes & sustains above 1100 on a weekly basis, then we expect momentum from there.)
.
I am not a SEBI Registered. This analysis is purely for educational purposes only.
.
If you gain some learning from this chart, then please like this post for more reach & also do comment if you have any questions regarding this.

Re-tested its support line. Ready for up move. Good Risk RewardRe-tested its support line. Ready for an up move. it is at Good Risk Reward

Motilal Oswal Long SetupMotilal Swing long setup
: Motilal again has a huge imbalance
: Motilal can chase the full imbalance
: Small base
: sl should 2% or 1124 do not exceed that
: liquidity grabs below this level can take place doesn't mean we will make o

Motilal Oswal Motilal Oswal is in acclimating zone. Good to accumulate right now as the volume on up days are increasing which shows institutions are active

Trendline Breakout - MOTILALOFSPlease look into the chart for a detailed understanding.
Consider these for short-term & swing trades with 2% profit.
For BTST trades consider booking
target for 1%-2%
For long-term trades look out for resistance drawn above closing.
Please consider these ideas for educational purpose
Please note that, if there are some big targets, those are drawn thinking for long term.

MOTILAL OSWAL LOOKS GOODThe stock had a strong resistance at the 931 levels and it has successfully breached it to reach higher also apart from consolidation it has formed a series of cup and handle pattern and it has given a breakout from the same for the short term the stock can rally and give steady returns of 40% till 1400 if market conditons favour after that long term target would be 1588 which on breaking the lifetime high resistance can give unprecedented rally in the stock

MOTILALOSWAL 📌SWING TRADE FOR NEXT WEEK🚀
Hello guys,
I am a swing trader by passion i only trade on swing stocks.
📌I post daily SWING CHARTS analysis on my trading view profile..
so let's start
📌TRADE ANALYSIS OF MOTILALOSWAL:-
•Breakout of symetrical pattern on WTF with strong candle
•Break counter trend line and hidden lines
•Volume increases last few weeks high
•Bullish trend/ make good structure also
•Made good price action
•Make higher highs/higher lows
Add on your watch list....
📌 If you have any questions about any stock you can DM me Or comment on post 📱
📌Disclaimer:-
This all chatrs analysis are only for educational purposes only
I do not provide any CALL or Tips

BREAKOUT PICKDaily Trendline break with huge volume.
Can enter now with the given stoploss and target.

Wedge pattern Breakout in MOTILAL OSWAL$MOTILAL OSWAL FINA has broke a 7 year long Wedge Pattern with considerably high volume as Cherry on the top!! Other indicators seems Bullish to me. And (Drama Alert!!) I think this is a Very rare, Life changing, History making, Once in a lifetime opportunity to make some money FROM a Broker ifykyk(As there is a saying that "Broker's opinion of a stock is an excellent thing to consider - in reverse ")
(;¬_¬)
Well, as always, This is not a Financial Advice. Just a mere Analysis done by me. Always do your own research before trading. Take Care. Have a Good Trading Day.
P.S. If this message is being read by a Broker please do not take my lame jokes personally (^_^)v

924 above MOTILAL BreakoutTriangle breakout above 924
Above 924
Target 944, 1000
SL : 899
Risk is yours and Reward is too yours

Motilal Oswal chart ideaMotilal Oswal chart is near the resistance levels and on the verge of some good move.
Long term Downward line pattern to break on the up. If breakes up with volume then the levels can be 1029-1169-1318 with the support levels of 736-570.
It will depend on the overall market conditions for such a move.
No recommendations, just my view based on the chart pattern.

Motilal Oswal: Trading near breakout level on MTFMotilal oswal is looking good on monthly time frame. Stock is attempting multiyear breakout. Keep on radar.

At resistance zoneSell if low break of 6/10/23 candle,buy if high brakes.
At monthly strong reistance, can be a big movement from here.

📈 Exciting Bullish Pattern Alert! 🐂📈 Exciting Bullish Pattern Alert! 🐂
📊 Pattern: Falling Channel
📌 Symbol/Asset: MOTILALOFS
🔍 Description: Stock is going down in a falling channel after uptrend which is bullish sign. after breakout we can see huge upside in the stock.
👉 Disclosure: We are not SEBI registered analysts, this is not a buy or sell recommendation. Technical patterns are just one piece of the puzzle. Consider conducting further research, consulting with a financial advisor, and managing your risks appropriately.

MOTILAL OSWAL FIN SERVICES LTD«🫴 MOTILAL OSWAL FIN SERVICES LTD 🤏»
👀 Stock with decent fundamentals trading at a very low PE of 9 is looking good for medium to long term holdings , only problem with the stock is the increasing debts and slowdown in growth of profits
👀 Stock has formed a higher low in bigger time frames like monthly and above , showing buyers coming in the stock , stock is trading above its demand zone and can move towards 1200/1500 levels in coming days , CMP 880 , SL can be taken of 8-10%
👀 : Take strict SL as its a risky stock with changing fundamentals , happy to risk 10% for a reward of 30% , happy to go wrong but no point holding if view goes wrong🙏🙏

Trade-17/100-MOTILAL-R:R Experiment-Buy16th trade in the series
Buying MOTILAL in DAILY positional trade
