Trade ideas

MPHASIS 1D chart making a trianglePlease enter the trade once u get a proper breakout or reversal from the levels, Do not hesitate to contact me with any queries. Kindly support my views. Thanks

#MPHASIS DAILY CHART VIEW!!#MPHASIS DAILY CHART VIEW!!
Mphasis Ltd. trading in an uptrend and constantly respecting uptrend line and 50 SMA.
Presently the stock consolidating in a narrow range and likely to see further momentum above 1415 level.
Technical parameters looks neutral as of now.
Keep a watch.

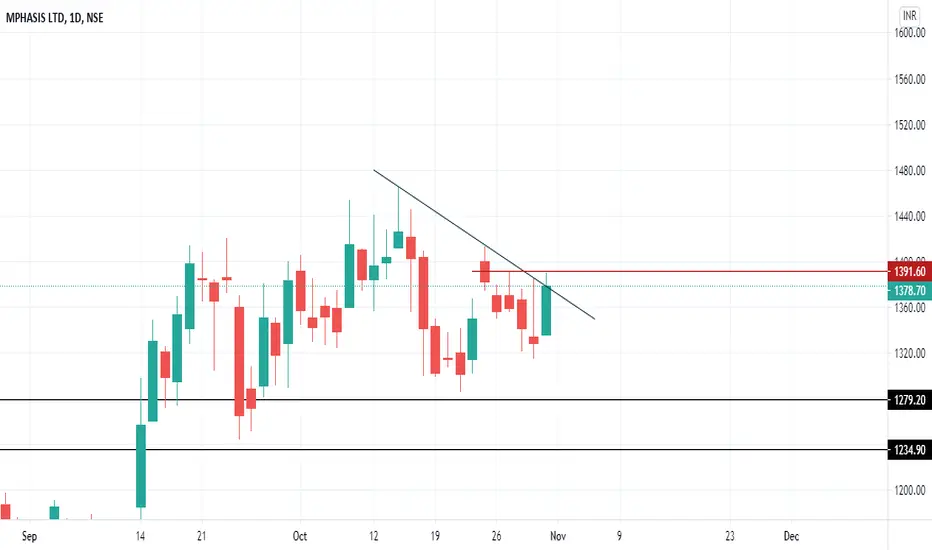
Stock Analysis of MphasisPrice- ₹1378.70 Dt. - 30-10-2020
Today price made the bullish engulfing pattern on the daily chart at the end of the trading session. on 29th Oct. the price took the support of the trendline and today the stock given the close above 21DEMA. RSI is neutral on the daily chart but on the weekly chart, the stock is near the 70 in RSI. If open in green in the next trading session than it could be the buy signal. If the market condition remains positive than stock can break the 52 week high.


MPHASIS BUY CALL FOR FUNDAMENTAL TRADERAny of my investment or trades I share on my view are provided for educational purposes only and do not constitute specific financial, trading or investment advice. ... You must be aware of the risks and be willing to accept them in order to trade or invest in markets. Don't trade with money you can't afford to lose.


MphasisNeeds more clarity. In a tight weekly uptrend. Wait for a trend line retest. We will look for a tight stop loss to enter.


MPHASIS Positional | Cup & handle + Trendline BreakoutCMP : 920
SL : 823
Target : 1060, 1150
1) Very bullish trendline breakout
2) High dividend paying company so attracting buyers more on dips. Recently provided Rs.35/- per share, that is almost 3.5% yield.
3) Excellent delivery volume last 2 weeks, on average the company is having 40% + almost everyday.
4) Cup & Handle is pattern is very strong in sideways market
Consider buying in dips.

MPHASIS, 1.5 YRS BREAKOUT (WILL IT SUSTAIN TOMORROW?)MPHASIS has given closing just about important long running TL since Feb'19. This TL was respected 6-7 times in past making it very critical.
MPHASIS should be bullish above 933 (936 for safe trader).
Price action trading is a process of using price to analyze stock possible movement. Keep your charts as simple as possible so that you keep focus on most important element on chart "PRICE".
If you receive any benefit from idea, appreciate by your likes/comment. If you earn from my ideas, kindly consider donating small part of your profits to those in need.
Reach out if you wish to learn simplest form of price action and willing to put effort in practice.
Cheers!
Piyush Gupta


Mphasis Ltd. - WILL IT BREAK THE RESISTANCE ?Mphasis Ltd.
The stock faced resistance from 895 zone and also faced resistance from 200 day SMA in Daily Chart.
Technical indicators are bullish. Time-Trend Indicator is also Bullish.
If price breaks the 200 day SMA resistance and closes above 900, the next resistance is 957 and the support is 100 day SMA (810) on the daily chart.
KEEP AN EYE!! #B+


MPHASIS Chart Case-1: Buy above 929.9
Targets are 931.9,938,940,954.35,958.85,966++
SL-949.65
Case-2: It may fall from 927.15 to 905.2(@Channel Bottom) and there is bounce back, Buy after it reaches Channel Bottom
Targets are 917.3,918.8,921.65,931.9,939,940.9++
SL-930.3
Case-3: Sell below 930.15
Targets are 924.8,923.1,921.95,919.3,916.5,910--
SL-938


