MPHASIS
Major price corrections in the past had been around 50-65%, which was expected to be done when stock made low of 1660.
In December 2023, price cleared its resistance around 2435 along with the Monthly MACD crossing above its Trigger line.
This suggests that the long term uptrend is now likely to resume.
If price is to continue its past behavior, it could head to 6800.
For momentum traders/investors, stop loss could be 2400, but this bullish outlook remains valid as long as price is above 1660.
Trade ideas

mphasis buyBuy from cmp to 2570
sl close belwo 2560
easy tg - 2720
Not suggested
Disclaimer : This is my personal analysis for study purpose not intended for trading.

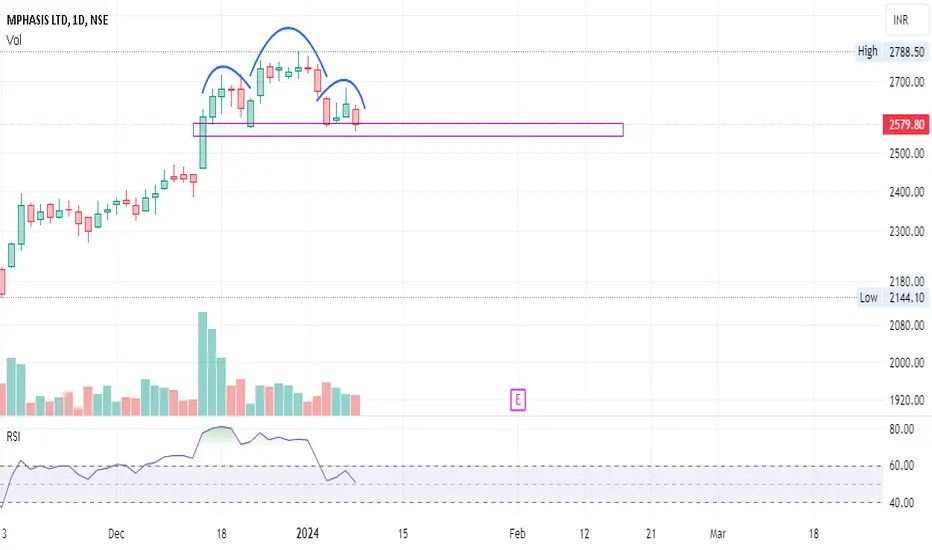
Mphasis Forms Head and Shoulders Pattern: Time to Take NoticeThe stock, Mphasis has recently developed a Head & Shoulders pattern, signaling a potential trend reversal. Traders should exercise caution and consider implementing proper risk management strategies. On the chart, clear indications for stop-loss and two target levels have been outlined.
Please note that this information is not financial advice but a market observation. Always trade responsibly and make decisions based on your analysis and risk tolerance."

a clear boomafter a long a good sr support is visible which can give desired targets lets wait and see what do we get a target or sl

Mphasis Ltd-IT sector boom in short termMphasis Ltd
solutions provider specializing in providing cloud and cognitive services, applies next-generation technology to help enterprises transform businesses globally.
ROCE 28.9 %
ROE 21.9 %
Debt to equity 0.03
Promoter holding 55.6 %
Piotroski score 6.00
this is momentum debt free stock.
pls like follow share and boost for more ideas.

Mphasis Long Term BetGood Entry Point from 1847 on monthly Demand.
SL - 1482
T1 2599
T2 - 2863
T3 - 3375
Horizon 1 Year

C & H BO STOCK has given good breakout in c&h patterns
only for educational purpose
not for recommdation


MPHASISBUY @ 2658.90 RS
TARGET 1@ 3006.35 RS
TARGET 2@ 3395.65 RS
BUYING CONFIRMATIONS: Cup with handle breakout with strong weekly closing
Overall expected returns are around 27.65 %

Comprehensive Exploration of Fibonacci RetracementUnderstanding the Fibonacci Retracement Tool:
Mathematical Roots: The Fibonacci retracement tool finds its origins in the intriguing Fibonacci sequence—a mathematical concept where each number is the sum of the two preceding ones (e.g., 0, 1, 1, 2, 3, 5, 8, 13, and so forth). This sequence forms the groundwork for a technical analysis tool that seeks to unveil potential support and resistance levels in financial markets.
Application in Technical Analysis: Traders and analysts harness the power of Fibonacci retracement to decipher probable levels where price movements might stall, reverse, or undergo significant shifts. The tool is a crucial component of the trader's arsenal, offering insights into market sentiment and potential turning points.
Deconstructing Fibonacci Retracement Levels:
Connecting Pivotal Points: The process of employing Fibonacci retracement involves connecting two critical points on a price chart—the high and low of a recent price swing. This connection gives birth to horizontal lines, each corresponding to a specific percentage level. Key retracement levels include 23.6%, 38.2%, 50%, 61.8%, and 78.6%.
Degrees of Retracement: Each retracement level serves as a numerical representation of the extent to which the price retraces a prior move. Traders often observe these levels as potential zones of interest, although it's crucial to note that they do not guarantee support or resistance but rather signify areas worthy of attention.
Significance Amplified: The Self-Fulfilling Prophecy:
Market Psychology at Play: One of the fascinating aspects of Fibonacci retracement is its role as a self-fulfilling prophecy. The efficacy of these retracement levels is often heightened by the collective belief and actions of market participants who use and trust in the tool. As a result, Fibonacci retracement becomes a dynamic force influencing market behavior.
Strategic Applications of Fibonacci Retracement:
Price Reversal Zones: Fibonacci retracement strategically identifies zones where price reversals may occur. For instance, in the context of an uptrend, a retracement to the 61.8% Fibonacci level might signal a potential entry point for traders anticipating a resumption of the upward trajectory.
Entry/Exit Confirmation: Traders frequently intertwine Fibonacci retracement with other technical indicators to confirm entry or exit points. This multi-faceted approach provides a more robust foundation for decision-making.
Trend Strength Assessment: Beyond predicting reversals, Fibonacci retracement aids in assessing the strength of a prevailing trend. Shallow retracements (23.6% or 38.2%) may indicate a resilient trend, while deeper retracements (61.8% or 78.6%) could signify a weakening trend or the possibility of a trend reversal.
In Conclusion: Unlocking Potential with Fibonacci Retracement:
Versatile Decision-Making Tool: The Fibonacci retracement tool stands as a versatile instrument in the trader's toolkit, offering not just numerical levels but a nuanced understanding of market sentiment and potential trend shifts. Its application extends beyond mere prediction, providing traders with actionable insights for more informed decision-making in the dynamic world of financial markets.

Symmetrical Triangle Breakout Can Move 30% From HereThis 2-day timeframe chart showcases a robust breakout scenario with a prominent symmetrical triangle pattern.
The price is currently propelled by a formidable bullish momentum, highlighting a sustained uptrend.
Noteworthy volumes, coupled with massive volumes near the breakout zone, underscore strong market participation.
Symmetrical Triangle Breakout: The chart exhibits a clear symmetrical triangle pattern, indicative of a significant breakout.
Bullish Momentum: The price is riding a strong bullish momentum, affirming the prevailing upward trend.
High Volume Confirmation: Robust volumes accompany the breakout, providing a solid foundation for the upward move.
Price Target: Anticipating a move up to 3450, representing the 2nd resistance level, implying a potential 30% gain from current levels.
Consider a long position with the breakout confirmation, ensuring sustained volume supports the move.
Set profit targets based on the projected 30% move and adapt strategies as the trend evolves.
Employ prudent risk management practices to mitigate potential downsides.
Disclaimer:
This is not financial advice. Conduct your analysis and risk assessment before making trading decisions. Monitor price action and adapt your strategy based on evolving market conditions.

Triangle Pattern Breakout - MPHASISPlease look into the chart for a detailed understanding.
Consider these for short-term & swing trades with 2% profit.
For BTST trades consider booking
target for 1%-2%
For long-term trades look out for resistance drawn above closing.
Please consider these ideas for educational purpose
Please note that, if there are some big targets, those are drawn thinking for long term.

MPHASIS BO [DAILY]IT sector is building a momentum for now and constituents of IT index are showing strength. MPHASIS is one of them I studied a while back, it rides on pretty heavy financial clients majorly US banks, and seeing this BO makes one think if this can follow up ahead.
Momentum certainly feels to be creeping in.

MPHASISMPHASIS Breaking dynamic trendline. 2525 is a first Target. 2388 is stop loss. In the Target level price reaction confirm the next rally to reach 2735.

Resistance Trendline Breakout : MPHASISIn Mphasis, there is a resistance trendline broken so good candidate for opening a long position.
PFB the key levels
EN - 2427, TP - 2552, SL - 2326

MPHASIS TRENDLINE REVERSALNSE:MPHASIS
Mphasis Ltd. engages in the provision of application development and maintenance services, infrastructure outsourcing, and business and knowledge process outsourcing solutions. It operates through the following segments: Banking and Financial Services, Logistics and Transformation, Technology Media and Telecom, Insurance, and Others.
Trendline Support + just dropped below 200 EMA and started consolidating.
Major support and resistance flip Zone.
Nifty It closed around 200 ema support.
The low is 0.5 fib retracement or major bull trend.
StopLOSS - Below Flip zone.
Check the chart for a visual view.
Keep learning.
Happy Trading.

IT stock to watch before reversalIdea is shared as Long term reversal pick only for educational purposes.
Stock name:-Mphasis
Market cap around 40000 crore
Buy in range of 1950-2050
Technically IHNS Breakout above 2500.
SL below 1650 WCB
Targets 3500, 4000++
Diving into some fundamental ratios at CMP:-
PE ratio-25 (Near 5 yr median PE and industry PE)
ROCE-28.9%
ROE-21%
Debt/Equity-0.2|| Debt/Earnings-0.96
Div yield above 2%
Promoter holding above 55% with no holding pledged.
One noteworthy observation is DII have increased stake from 17.78% to 22.55 % in last 1 year.

Mphasis -22.11.2023Trigger live above 59.22 will reach 66.95, Cash Price -24-45
Trigger line below 51,93, will reach 43,33, Cash price - 24-45

Education price action analysis - MphsisPrice testing a resistance area again and again...
BD and retest has happen..
In such a scenario.. it should fall..
Entry Below 2350
T 2196
SL 2444

Mphasis - Intraday _ 06.11.2023MPHASIS 15 MINUTE CHART -INTRADAY 06.11.2023
If trigger line crosses over 60.51, it may reach to 67.70, 40 to 60 Rs in cash.
If trigger line crosses below 52.40, it may reach to 40.31, 40 to 70 Rs in cash.

📈 Exciting Bullish Pattern Alert! 🐂📈 Exciting Bullish Pattern Alert! 🐂
📊 Pattern: Broadning Pattern
📌 Symbol/Asset: MPHASIS
🔍 Description: Stock is in a Broadning pattern. And now around the support. We can see good upside is price respect the support.
👉 Disclosure: We are not SEBI registered analysts, this is not a buy or sell recommendation. Technical patterns are just one piece of the puzzle. Consider conducting further research, consulting with a financial advisor, and managing your risks appropriately.

MPHASIS (GATE ANALYSIS)Gate analysis (30 Min)
If price sustain above 2525 with good volume
Buy@ CMP
StopLoss@2470
Multi TF ( As per gate analysis)
1. On 5min & 15min it was proper time correction
2. On 30min forming gate (wait for 2525 B.O)
3. On 1hr it was 50 ema retest
4. On Daily Tf it was 20 ema retest.
Satisfy all condition
Note: Also IT Sector have some good space in this market situation.
