MAHINDRA AND MAHINDRA LTD BREAKOUTTriangle breakout in M&M ltd. Ichimoku cloud also giving positive sentiment. CMP breaking cloud and future cloud about to turn green. keep SL below fibonacci 0 and follow the targets on the chart.
M_M trade ideas

M&M - BullishTriangle breakout
Taking support at previous lows (Double Bottom)
Good Risk to Reward from current levels too

M_M SIMPLE PRICE ACTION APTTERNMahindra and Mahindra has broken out of its triangle pattern. I have taken an entry on 801 with a stoploss of 767 and a target of 930. follow the pattern and do not abandoned the plan.
PEACE OUT.

[ INTRADAY ] M_M LONG BETrisk: Reward ratio is 1: 2
Rest as per Charts
********
Note -
One of the best forms of Price Action is to not try to predict at all. Instead of that, ACT on the price. So, this chart tells “where” to act in “what direction. Unless it triggers, like, let’s say the candle doesn’t break the level which says “Buy/Sell if it breaks”, You should not buy/sell at all.
=======
I use shorthands for my trades.
“Positional” - means You can carry these positions and I do not see sharp volatility ahead.
“Intraday” -means You must close this position at any cost by the end of the day.
=======
Always follow a stop loss.
In the case of Intraday trades, it is mostly the “Low/High of the Candle”.
In the case of Positional trades, it is mostly the previous swings
********

Breakout in Mahindra & MahindraBreakout from a Triangle Pattern...looks good for the targets of 850-860

TRIANGLE + HEAD AND SHOULDER IN M_MIn dtf forming triangle pattern and 4hr tf look like a inverted head and shoulder if close above the neckline of the h/s and triangle pattern may go bullish in short term 15 to 18%

M&M | Trendline breakout after long time - Potential for 20%M&M | Trendline breakout after long time - Potential for 20%
CMP : 796 (Dip : 770)
SL : 755
Target : 955
Almost 1:4 risk reward setup


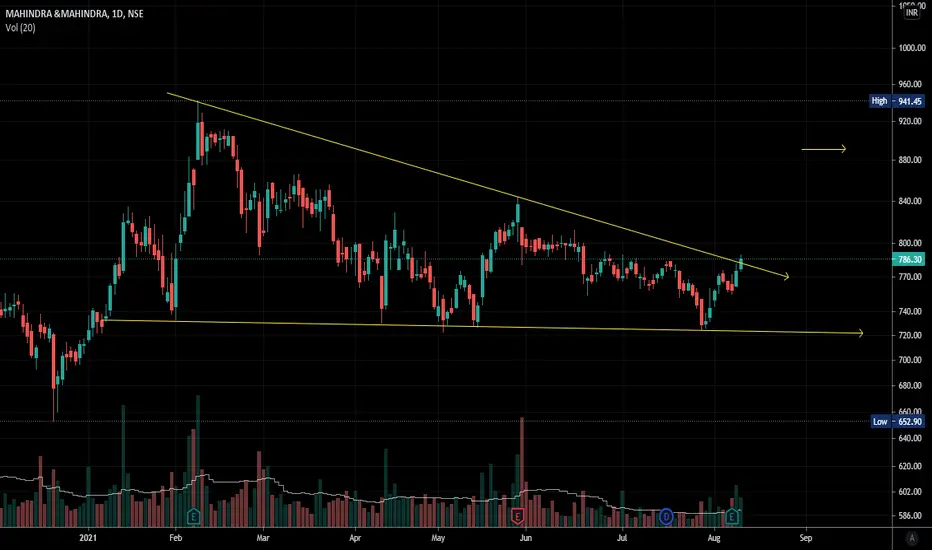
Mahindra: The XUV 700 effectMahindra and Mahindra has a descending triangle formation which often results in bearish outcomes. But there is huge excitement due to the XUV 700 reveal and it is promising to shake up the suv segment. So how to make money out of it. Let's see. Price has been making bottoms around the 743 mark and making lower highs following a trendline and trading at a discount from its previous high. It is taking good support on 50Ema and is trying to break this trendline for last few sessions. And there I see the opportunity. It will become bullish once it break out of the trend line and 797 resistance with volume. You can then expect it to hit, 853, 952 and 993 which would be your profit booking areas. 743 can be your stop-loss or if you want to set a hard one, make that 725. Also look at the monthly chart and you'd see a bull flag formation in the disguise of that descending triangle.

MAHINDRA & MAHINDRA.... CAN ACCUMULATE Mahindra and Mahindra, a worthy stock to be in one's portfolio, had been consolidating for more than 6 months now.
Recently the script seemed to have broken out of the triangle pattern.
The AUTO sector per se is not performing well for the past few months. Results have been below estimates because of lockdown, and global semiconductor shortage could be some of the reasons.
The recent change in the company's logo and introduction of XUV700 could be considered positives for M&M.
Technically looks good to accumulate for the long term.
The 200-day SMA can act as a support at the current price level.
Short-term targets can be 835 and 885.
Being a large-cap company with a market cap of more than 90,000 crore rupees, M&M should be a safe bet.
Add to your watchlist and trade when the script moves up.

M & M breakoutThe support zone is clear. Volume will play major role in breakout. Bulls are coming for this one

M&M : Triangle M&M
- Near TRIANGLE breakout
- MACD above 0
- MACD Signal above then signal line
We may see breakout here.
For Educational purpose only

M&M sell below 1372Condition
Market sentiment must be negative
Price sustains below given level
Trail your stop plus if you are taking trade
It is only for educational purpose

M_M IF DAY CANDLE CROSS 795 then it will be Bullish to the respected level or if it breaks 749 then it will Bearish

M&M SHORT BELOW 773Conditions
Market sentiment should be negative
Price must sustain below 773
Always Trail you stop plus

SCORPIO TRYING TO BREAKOUT Good level on a daily time frame.
Create your buying opportunities accordingly

M&M 1hr analysisM&M has previously broken the support and now
it has regained it, it has even broken the trendline
and it has given a retest, it would be a perfect
level to enter, 795 should be the target.


M&M triangle pattern breakout with reverse Head & ShoulderM&M triangle pattern breakout with reverse Head & Shoulder NSE:M_M
M&MStock has given breakout from descending triangle pattern. Buy above 780 TGT 8 to 10% SL 750. For educational purpose only. Kindly contact your financial advisor before entering any trade.

MEDIUM TERM TRADE - M&MA clean pole and Flag pattern in M_M.
M_M is consolidating inside an descending triangle which can be considered as a flag in higher time frame for a long time . now it has given a breakout from the pattern and we can try for an opportunity in here.
entry = 785
target = 950
sl = 750

Support and resistance It is on daily 200 MA support stock retraces to much now its time for breakout for the stock it is very good stock it is also on daily support

