NDTV - Weekly AnalysisIn the Weekly Chart of NDTV ,
we can see that; it is at decision making point.
Possible momentums are shown in chart.
NDTV trade ideas

NDTV - An Adani Group stock - 2x Potential!Overview & Observation:
1. Price Structure is bullish.
2. Downside risk is minimal.
3. RR is favourable.
4. Recent quarter earning reports are +ve as well.
5. Multiple confirmations supporting the view & expected to see the price start moving higher from here on but momentum will take some time to built...
Trade Plan:
Entry = Above 273
Sl = 15% close to 230
TP = 500+
- Stay tuned for further insights, updates and trade safely!
- If you liked the analysis, don't forget to leave a comment and boost the post. Happy trading!
Disclaimer: This is NOT a buy/sell recommendation. This post is meant for learning purposes only. Please, do your due diligence before investing.
Thanks & Regards,
Anubrata Ray

Approaching Symmetrical Triangle Apex – Watch for Breakout
The stock is forming a symmetrical triangle, approaching the apex, suggesting a potential breakout.
The RSI is at 54.41, indicating neutral momentum with a slight bullish bias.
The MACD is showing a bullish crossover, with the histogram moving towards positive territory, indicating a potential shift in momentum.
A recent increase in volume supports the possibility of a breakout.
Immediate resistance is at ₹320, with support at the lower trendline around ₹220.
A breakout above ₹320 with increased volume could signal a strong bullish move. Monitor for confirmation of the breakout for potential entry.

NDTV - Weekly AnalysisIn the Weekly Chart of NDTV ,
we can see that; after breakdown, it is trying to give W shape recovery.
Expected momentum are shown in chart.

NDTV Stong cantidate for further rallyAs the stock is trading in limited range from last 4 months, now the following is noticed :-
1. MACD crossover on daily chart near just below the centre line which can be crossed with heavy price action.
2. RSI crossed yellow line turning to be bullish.
3. Trading above 20 and 50 days moving averages.
4. The consolidation phase between 240 and 300. The stock is not breaking lower levels which is bullish sign for stock.
So, one can long this stock for short term target 300 and 350 and 380 levels with strict stop loss 230.

NDTV: Strong Bullish Momentum - Potential Move Towards 425Technical Analysis Overview: NDTV is currently exhibiting strong bullish momentum, positioned well above its support zone and indicating potential for a retest of the 425 level.
Flag Pattern Breakout: The stock is on the verge of breaking out of a flag pattern, suggesting a continuation of the upward trend.
50 EMA Support: The 50-day exponential moving average (EMA) is acting as a robust support level, reinforcing the bullish sentiment and providing stability from lower levels.
High Volume Confirmation: Accompanied by high trading volume, the recent price action is backed by strong participation, indicating heightened investor interest and confirming the bullish outlook.
Rising ADX: The rising Average Directional Index (ADX) further emphasizes the strength in momentum, suggesting the potential for sustained upward movement.
Trade Idea: Consider initiating or adding to long positions in NDTV, targeting a move towards the 425 level. Set stop-loss orders to manage risk effectively, with potential for further upside if the bullish momentum continues.

NDTV heading towards 319NDTV seems heading towards 319 after a breakout on daily time frame.
This is not buy sell reco as I am not SEBI regd

NDTV | Swing Trade📊 DETAILS
Sector: TV Broadcasting & Software Production
Mkt Cap: 1,860 cr
New Delhi Television Limited (NDTV) is in the business of television media and currently operates three channels including a dual-channel (NDTV 24x7, NDTV India, and NDTV Profit). NDTV, through its subsidiaries, has expanded its presence beyond news and television into digital content, e-commerce, etc.
TTM PE : 164.86 (High PE)
Sector PE : 34.98
Beta : 1.79
📚 INSIGHTS
Mid range performer
Stock with medium financial performance with average price momentum and valuation. These stocks may be affordable and are showing some investors interest.
6.54% away from 52 week high
Outperformer - New Delhi Television up by 6.24% v/s NIFTY 50 up by 3.1% in last 1 month
📈 FINANCIALS
Piotroski Score of 4/9 indicates Weak Financials
Disclaimer: This analysis is for educational purposes only, and I'm not a SEBI registered analyst.
If you found this analysis helpful, I encourage you to like and share it. Your observations and comments are also welcomed below. Your support, likes, follows, and comments motivate me to consistently share valuable insights with you.
🔍 More Analysis & Trade Setups 🔍
For more technical analysis and trade setups, make sure to follow me on TradingView: www.tradingview.com

NDTV Analysis & PredictionThis is the analysis of NDTV in Daily Time Frame. Watch carefully. The chart explains itself.
The stock managed to break the Rectangle Pattern with volume. Now retesting the breakout level. If it will sustain above the breakout level, it is good for the stock. Generally Rectangle Pattern Breakout is a bullish signal for stocks.
There are some prediction levels. These Levels act as Support and Resistance according to position of price. You have to trade according to level breakout or breakdown.
Always maintain your risk management.
Book your profit according to your “STOMACH”.
Disclaimer:
This is not investment advice. I am not a SEBI Registered Analyst. Anything posted here is my own analysis and views. This is created for educational purposes only. Always consult your Financial Advisor before taking any decision or trade.
Happy trading.
About NDTV :
New Delhi Television Ltd. engages in the provision of telecommunication, broadcasting, and information supply services. The company was founded by Prannoy Roy and Radhika Roy in 1984 and is headquartered in New Delhi, India.

Break of trendline with high volume1.Formation of cup pattern and breakout
2.Choch happened NDTV has been in downtrend after consolidation foe 300 days it gave a good breakout with good volume
3.RSI took support from 60 and ready to rally
276.9 would be a great resistance

NDTV | Investment Pick📊 Details
New Delhi Television Limited (NDTV) is in the business of television media and currently operates three channels including a dual-channel (NDTV 24x7, NDTV India, and NDTV Profit). NDTV, through its subsidiaries, has expanded its presence beyond news and television into digital content, e-commerce, etc.
Disclaimer: This analysis is solely for educational purposes and does not make me a SEBI registered analyst.
If you found this analysis helpful, I encourage you to like and share it. Your observations and comments are also welcomed below. Your support, likes, follows, and comments motivate me to consistently share valuable insights with you.
🔍 More Analysis & Trade Setups 🔍
For more technical analysis and trade setups, make sure to follow me on TradingView: www.tradingview.com

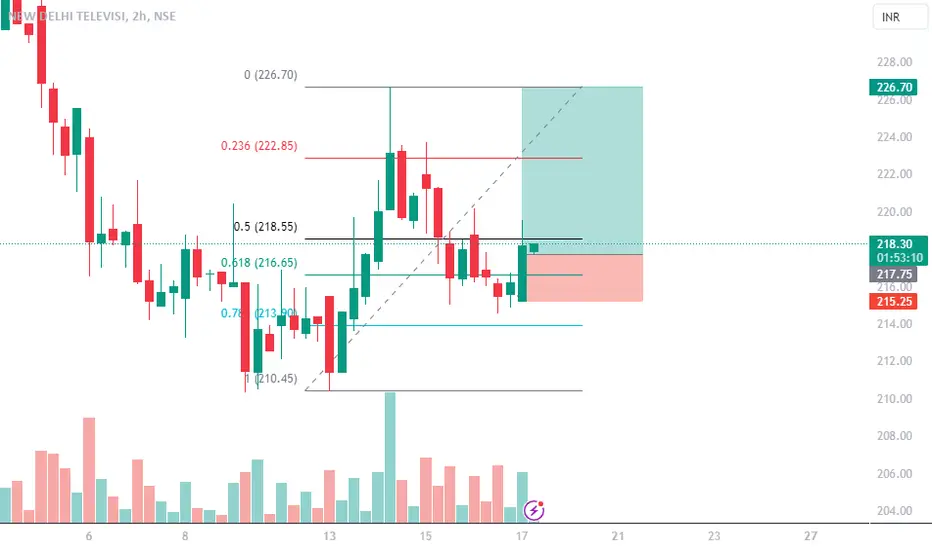
NDTV Buy price ActivatedNDTV is a good momentum stock that has shown quite bullish momentum today.
Stock has given the Breakout today. but came back to the zone, by looking to the bullish force today we can go for buying with good risk and reward of 1:5 setup. All levels are marked on chart.
Reason :
Trendline breakout with nice bull momentum.
RSI has a nice spike from oversold to bullish reason.
RSI trendline breakout.
High spike of Volume, shows bulls are overpowered.
Price > VWAP that shows the bullishness.
Good consolidition of more than 3 months.
Verdict :
Breakout successful, Strong bullish momentum
Plan of action :
Buy: 224.45
Stoploss: 212
Target: 277

Analyzing NDTV Chart: Breakout OpportunityHere's an in-depth analysis of the NDTV chart, highlighting a potential breakout trading opportunity based on crucial chart patterns.
🔍 Chart Analysis 📉
Breakout Alert: The weekly chart of NDTV showcases a significant breakout from a long-standing falling trendline. This trendline's steep angle, spanning over 45 degrees.
Consolidation Period: The stock has undergone almost 15 weeks of consolidation within a particular price range. Such prolonged consolidation often precedes a substantial price movement.
📊 Trade Strategy 📈
🔵 Entry: Consider initiating a long position at the current market price (CMP) of ₹224, taking advantage of the breakout potential.
🔴 Stop Loss (SL): Mitigate risks by setting a stop loss at ₹205. This level will help protect your position against unexpected adverse price fluctuations.
🎯 Target: Aim for a target price of ₹260. The breakout from the falling trendline and the consolidation period could propel the stock towards this level.
📣 Trade Analysis Summary 📢
The breakout from a steep falling trendline, coupled with the prolonged consolidation period, signifies a potential upward momentum for NDTV. However, always be cautious when dealing with strong trendlines, as they can also result in rapid reversals.
Trading carries risks, and it's advised to consult with financial experts and keep track of market developments before making any trading decisions.
#TradingAnalysis #BreakoutOpportunity #StockMarket #NDTV
(Note: This analysis is for educational purposes only and not financial advice. Always conduct thorough research before making any trading decisions.)

NDTV - Weekly AnalysisIn the Weekly Chart of NDTV ,
we can see that; it has made a decision making candle at Trendline.
Enter at 230 with SL as 218 and Target as 310-315.

NDTV Swing TradingNDTV For Swing Trading On weekly Chart
Price on Support on Weekly Chart
Good Marubozu Candle On Weekly Chart With Closing Above EMA(10)
Entry = 217
SL = 200
Target = 250

Educational Price Action AnalysisPrice action analysis of Adani Group
Quarterly 20 EMA Supports.... Generally, stocks of good quality should take support at QEMA, all F&O stocks have tested QEMA 20 and bounced back (except Adani port) but this candle is not yet closed.
Have mentioned support for all the cash group stocks also.
Adani Green - QEMA - 820
Adani Transmission - QEMA - 1284
Adani Power - QEMA 141
NDTV - QEMA 143
Adani Enterprises - QEMA 1395
ACC - QEMA 1877
Ambuja - QEMA - 325
Adani port - QEMA 562
Adani Total Gas - QEMA not available - MEMA - 2322 - Major support 1373
Adani Wilmar - Quarterly and monthly ema not available - Weekly 20 ema - 591, major support 391
As per Price Action Theory, this indicator is used by most.. let's see how this theory play here..
These levels are for learning purpose.

NDTV Weekly Chart Analysis NDTV Gives really good rally, but now after Breaking support it's headed towards Black TrendLine Support.

Long NDTV, Move is ON..NSE:NDTV
Target 2 achieved in #NDTV It is still looking strong, so target is further revised.
Here is previous chart:
Chart is self explanatory. Levels of breakout, possible up-moves (where stock may find resistances) and support (close below which, setup will be invalidated) are clearly defined.
Disclaimer: This is for demonstration and educational purpose only. This is not buying or selling recommendations. I am not SEBI registered. Please consult your financial advisor before taking any trade.

Buy Today, Sell Tomorrow: NDTVDON'T HAVE TIME TO MANAGE YOUR TRADES?
- Take BTST trades at 3:25 pm every day
- Book profits within the first 30 minutes of the market opening
- Try to exit by taking 3-5% profit of each trade
- SL can be taken when the 5/15 min candle closes below 44EMA
- SL can also be maintained as 1% or closing below the low of the breakout candle
The levels mentioned on the chart are calculated using the BREAKOUT INDICATOR
Now, why do I prefer BTST over swing trades? The primary reason is that I have observed that 90% of the stocks give most of the movement in just 1-2 days and the rest of the time they either consolidate or fall
Resistance Breakout in NDTV
Buy Today, Sell Tomorrow: NDTV

Buy Today, Sell Tomorrow: NDTVDON'T HAVE TIME TO MANAGE YOUR TRADES?
- Take BTST trades at 3:25 pm every day
- Book profits within the first 30 minutes of the market opening
- Try to exit by taking 3-5% profit of each trade
- SL can be taken when the 5/15 min candle closes below 44EMA
- SL can also be maintained as 1% or closing below the low of the breakout candle
The levels mentioned on the chart are calculated using the BREAKOUT INDICATOR
Now, why do I prefer BTST over swing trades? The primary reason is that I have observed that 90% of the stocks give most of the movement in just 1-2 days and the rest of the time they either consolidate or fall
Trendline Breakout in NDTV
Buy Today, Sell Tomorrow: NDTV

NDTV trade Red Alert
NDTV is approching its * All Time High*
All Time High act as a resistance, so those who are in this trade time to book your gains ( It may start lower circuit, exiting will impossible)
Almost done 90% from the analysis, I already bookout with full quantity.
Keep Hustling!

NDTV Delivery Setup
High chances are there for consolidation near the price level around 430-440.
Sellers might come into the market in that case.
If it breaks the 440 range with strong volume then look for buying else stay out of the market.
If you are a conservative buyer then look for buying opportunities at 360 and below that 275 is the level for buying.
Green Path indicates levels for Bullish,
Orange Path indicates levels for Sideways,
Red Path indicates levels for bearish.
Happy Weekend.
