Nestle India (D) - Breaks Out of Consolidation with ForceAfter a period of sideways consolidation following its September 2024 All-Time High, Nestle India has delivered a decisive breakout, signaling a potential resumption of its primary uptrend.
The Context: A Sideways Pause
Following a brief downtrend from its peak, the stock entered a sideways trading range. A key horizontal resistance level consistently capped any upward movement, keeping the stock in a state of consolidation.
Today's Decisive Breakout
Today's session (Thursday, October 16, 2025) decisively ended this sideways action in favor of the bulls:
- Strong Price Surge: The stock rallied by +4.52% .
- Confirmed Breakout: Crucially, the stock broke out and closed above the key resistance level , a strong positive signal.
- High Volume: The move was supported by a robust volume of 6.92 million shares , adding significant conviction to the breakout.
Broad-Based Technical Strength
This bullish price action is strongly supported by key momentum indicators across all major timeframes (Monthly, Weekly, and Daily). The short-term Exponential Moving Averages (EMAs) are in a positive crossover state, and the Relative Strength Index (RSI) is rising, indicating broad and strengthening momentum.
Outlook and Key Levels to Watch
With the breakout confirmed, the path of least resistance has shifted firmly upwards.
- Bullish Target: If the bullish momentum continues, the next logical area of resistance and potential price target is the ₹1,340 level.
- Critical Support & Confirmation: The former resistance level, around ₹1,241 , now becomes the most critical new support. Watching for the stock to successfully re-test this level and bounce with momentum would provide the strongest confirmation that this breakout is sustainable.
In conclusion, today's high-volume breakout is a powerful bullish event. The key now is for the price to remain above the ₹1,241 support level to validate the start of a new, sustained uptrend.
Trade ideas

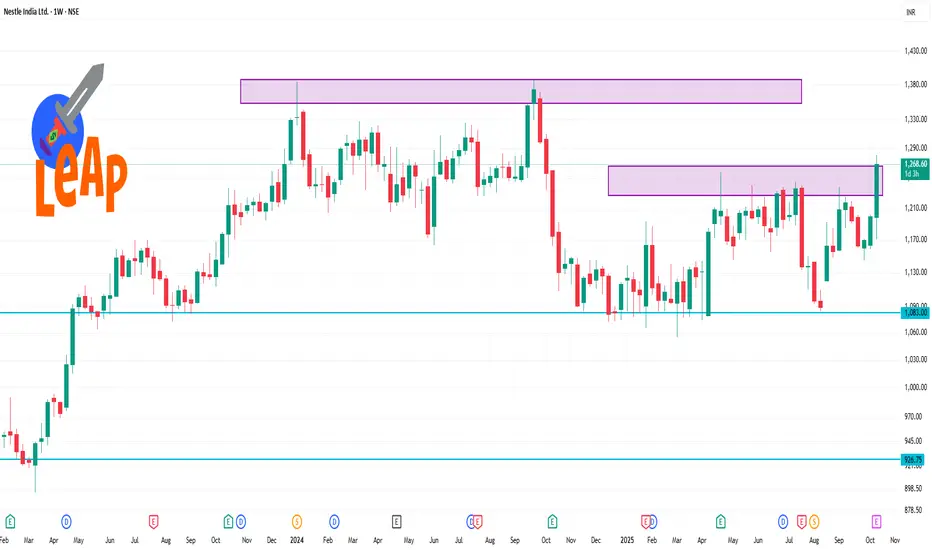
NESTLEIND 1 Week Time Frame📊 1-Week Performance Snapshot
Current Price: ₹1,264.90
1-Week Change: +6.5%
52-Week Range: ₹1,055.00 – ₹1,281.20
Day’s Range: ₹1,216.50 – ₹1,275.60
Volume: 1.61 million shares
📈 Technical Indicators
Relative Strength Index (RSI): Approximately 70.37, nearing overbought territory
Moving Average Convergence Divergence (MACD): Around +9.76, indicating bullish momentum
Support Level: ₹1,216.50 (recent low)
Resistance Level: ₹1,275.60 (recent high)
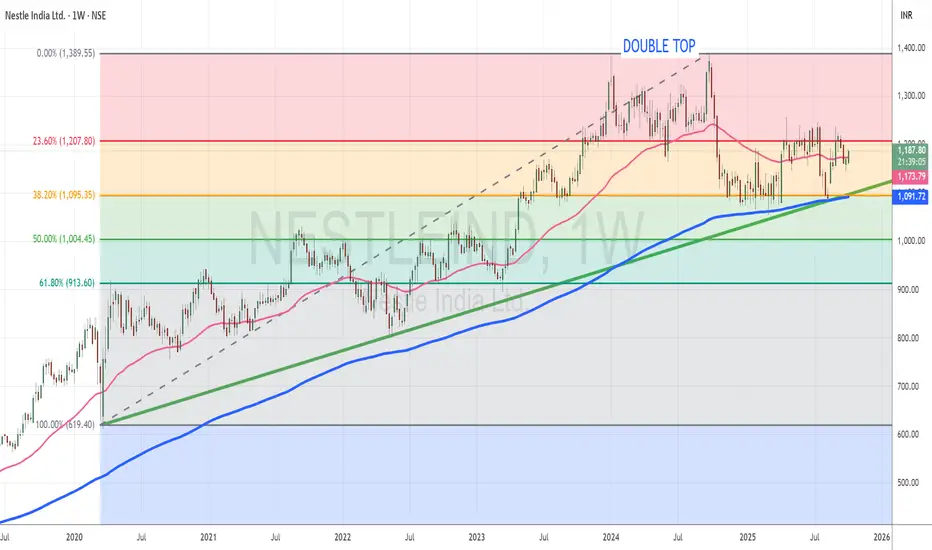
Nestle India eyes breakout after stock split boostTopic Statement:
Nestle India’s recent stock split has made the stock more affordable and liquid, as it now approaches key resistance levels with bullish momentum.
Key Points:
1. The price recently took strong support at the long-term trendline, resulting in a bullish deflection
2. The 38.2% Fibonacci retracement level at 1095 also provided crucial support during the recovery
3. The stock is currently attempting a breakout above the 23.6% retracement level at 1207, which could drive it toward its lifetime high at 1389
4. At 1389, the price may form a triple top candlestick pattern, and a successful breakout beyond this level could push the stock to new all-time highs
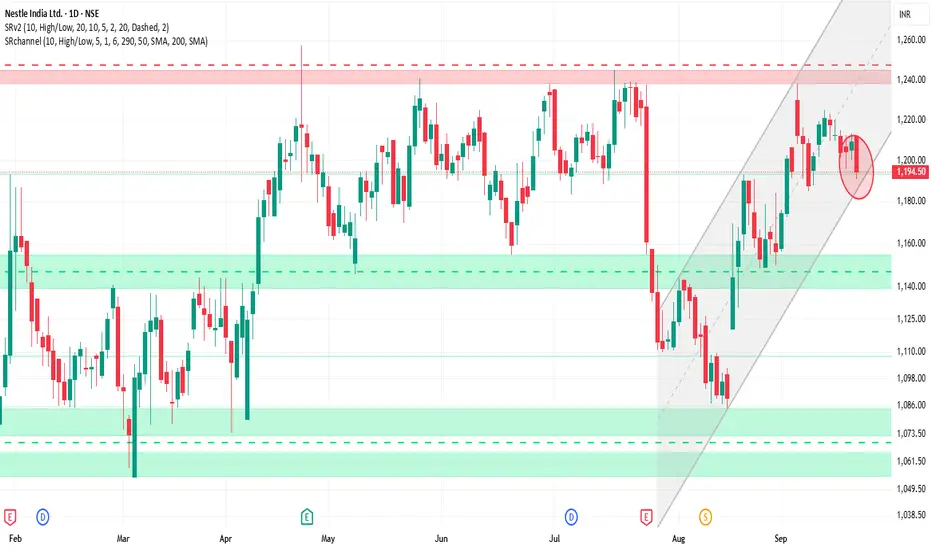
NESTLEIND 1D Time frame📊 Current Snapshot
Closing Price: ₹1,194.50
Day’s Range: ₹1,190.20 – ₹1,212.00
52-Week Range: ₹1,055.00 – ₹1,389.00
Volume: Approximately 2.4 million shares traded
Market Cap: ₹2,30,337 Crores
P/E Ratio: 78.40 (reflecting premium valuation)
Dividend Yield: 2.26%
⚙️ Technical Indicators
Relative Strength Index (RSI): 47.51 – Neutral
Moving Average Convergence Divergence (MACD): -4.12 – Bearish
Moving Averages: Mixed signals; short-term averages above the current price, while long-term averages are below, indicating potential resistance.
Pivot Points: Central pivot around ₹1,194.73, suggesting a balanced market sentiment.
🎯 Potential Scenarios
Bullish Scenario: A breakout above ₹1,197.26 with strong volume could target ₹1,202.16 and higher levels.
Bearish Scenario: Failure to hold above ₹1,187.46 may lead to a decline toward ₹1,183.83.
⚠️ Key Considerations
Market Sentiment: Nestlé India has shown strong performance recently, but broader market conditions can impact its movement.
Volume Analysis: Watch for volume spikes to confirm breakout or breakdown signals.
Technical Indicators: While the RSI indicates a neutral stance, the MACD and moving averages suggest caution.
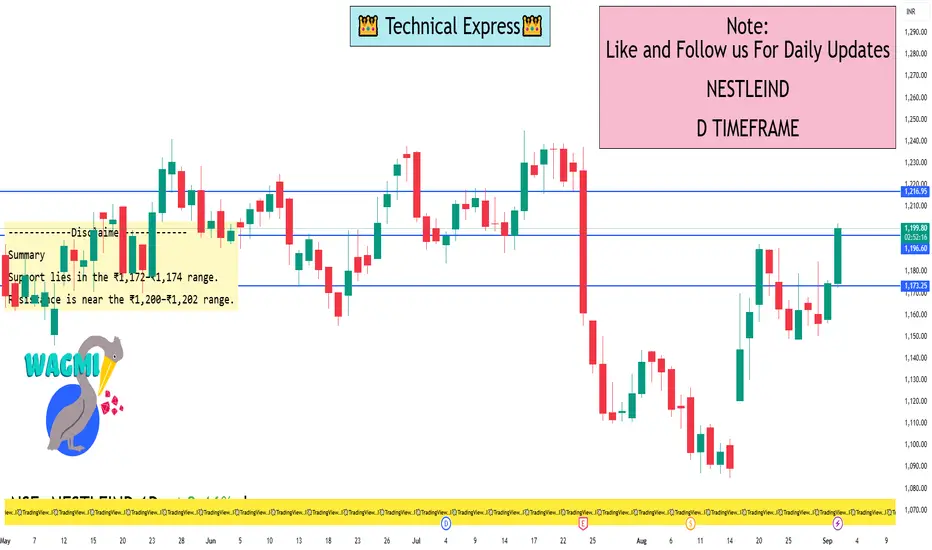
Nestlé India Ltd. 1 Day ViewCurrent Intraday Range & Price Highlights
Today's price movements show Nestlé India trading within a range of approximately ₹1,172 to ₹1,202, with the most recent prices hovering around ₹1,198.
As of September 1, 2025 (Monday), the stock closed at ₹1,174.20, marking a 1.61% gain, outperforming the Sensex, which was up by 0.70%.
1-Day Technical Levels
Level Type Price (Approx.)
Support (Intraday Low) ₹1,172–₹1,174
Resistance (Intraday High) ₹1,202
Previous Close ₹1,174.20
VWAP (Indicative) ₹1,188–₹1,189
These levels represent key intraday zones traders often monitor for entry, exit, or trend confirmation.
Summary
Support lies in the ₹1,172–₹1,174 range.
Resistance is near the ₹1,200–₹1,202 range.
VWAP (~₹1,189) suggests the average traded price today, offering insight into overall sentiment.
The previous day’s strong close (₹1,174.20) can act as both support and a momentum benchmark.
Nestle India Climbs Strongly Within Bullish Channel, Eyes PotentTopic Statement:
Nestle India is moving steadily upward in a strong bullish channel, setting up for a potential breakout as it approaches previous highs.
Key Points:
* The stock is trading in an up-trending channel, making it ideal for channel-based trading strategies
* It recently retraced to the 23.6% level and is now recovering, maintaining overall strength
* A previous double top suggests that a rise to those highs could trigger a breakout if resistance is cleared
* The price consistently rebounds when touching the 200-day EMA, reinforcing it as a strong dynamic support level

Long Nestle Target 3000+Nestle on charts has formed bullish harmonic pattern and have already achieved Target B.
Following are next targets
Target 1 - 2778
Target 2 - 3054
Target 3 - 3192
Stop Loss - Point D on chart
This is long term view.

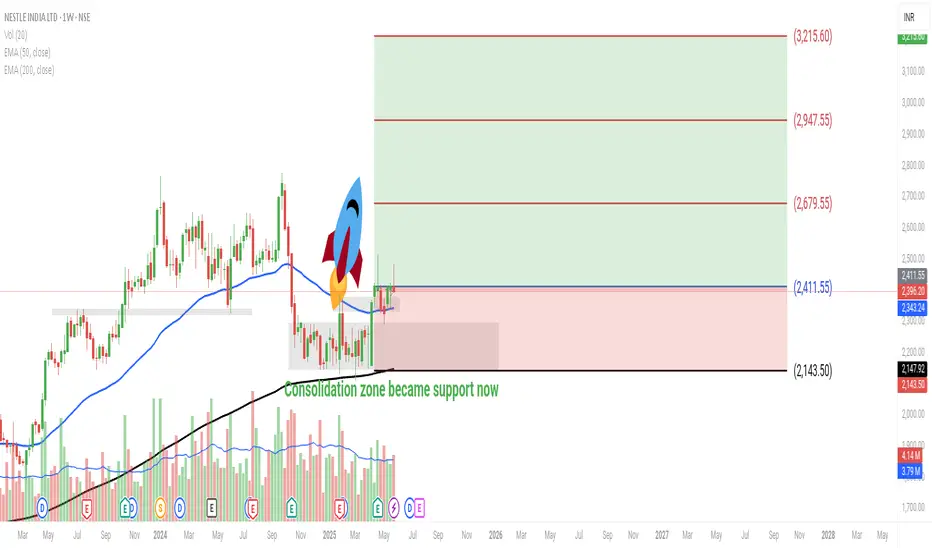
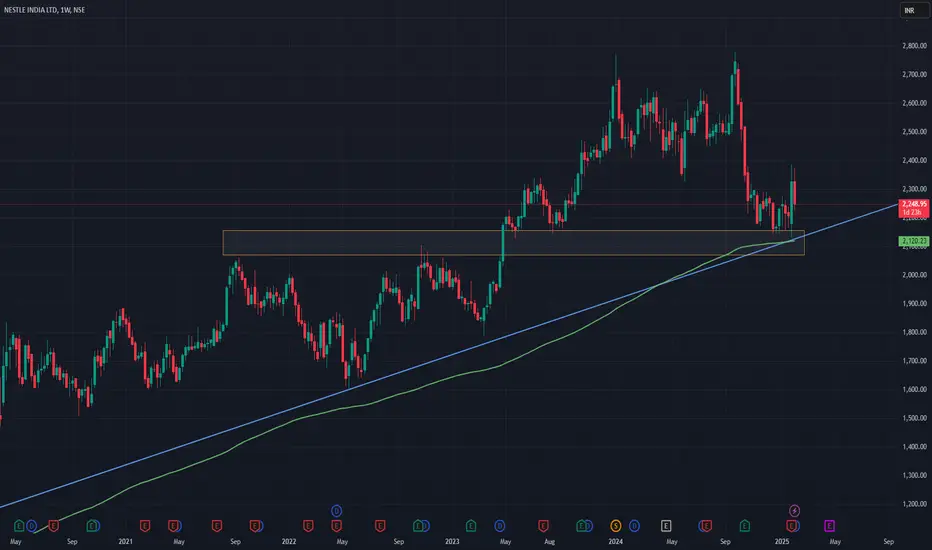
NESTLE INDIA - Ready for Takeoff ? NESTLE INDIA – Ready for Takeoff? 🚀
Stock: Nestle India ( NSE:NESTLEIND )
Timeframe: Weekly Chart
CMP: ₹2,396.20
Breakout Level: ₹2,411.55
Support Zone: ₹2,143 – ₹2,411 ✅
---
Technical View:
✅ After months of consolidation, Nestle India has finally broken out on the weekly chart.
📉 The previous consolidation zone has now flipped into a strong support base.
📊 We also see strong confluence with 50 EMA and 200 EMA — both have provided excellent support.
📈 We may have entered the early stages of a rally toward new all-time highs .
📉 Minor pullback now offering a great opportunity for positional entry.
✈️ Looks like Nestle India is ready to take off after a strong run-up from the runway of the 50 & 200 EMA!
🎯 Structure suggests strength, and the volume profile supports continuation to higher levels.
---
Target Levels:
🔸 1st Target: ₹2,679.55
🔸 2nd Target: ₹2,947.55
🔸 3rd Target: ₹3,215.60
Invalidation/SL:
🔻 Breakdown below ₹2,143 will negate the bullish setup.
---
Note: This is an educational view based on technical analysis. Please do your own research before investing. 📚
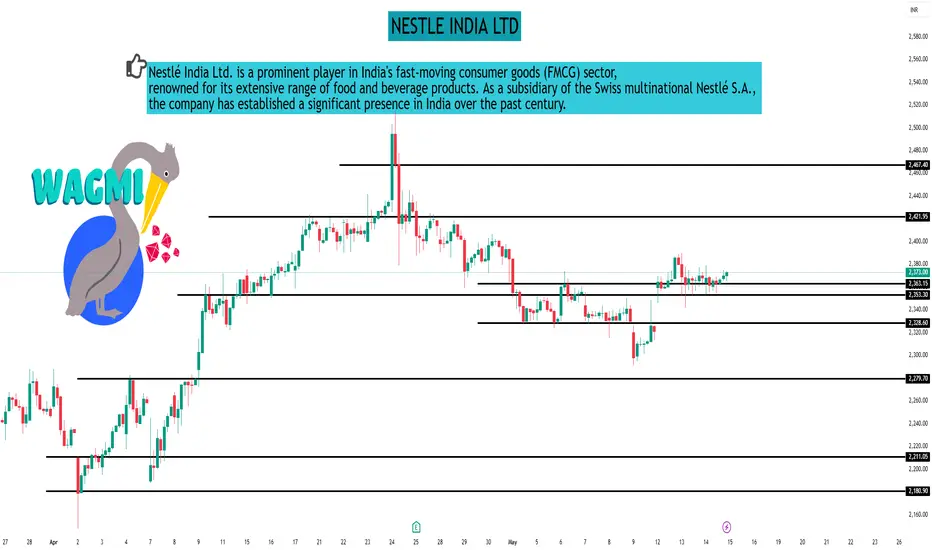
Nestle India Ltd Charts AnalysisHere is a **detailed business model** for **Nestlé India Ltd**, a subsidiary of Nestlé S.A., one of the world’s largest food and beverage companies.
---
# **Nestlé India Ltd – Detailed Business Model**
## **1. Company Overview**
* **Name:** Nestlé India Limited
* **Parent Company:** Nestlé S.A. (Switzerland)
* **Founded in India:** 1959
* **Headquarters:** Gurugram, Haryana, India
* **Sector:** Packaged Food and Beverages (FMCG)
* **Stock Listing:** NSE and BSE (Ticker: NESTLEIND)
---
## **2. Value Proposition**
Nestlé India provides **high-quality, nutritious, and convenient food products** tailored to Indian tastes and lifestyles. Key value offerings include:
* Trusted, global brands localized for Indian consumers
* Focus on health, wellness, and nutrition
* Innovation-driven product development
* Strong brand equity and household recognition
---
## **3. Key Products & Brands**
Nestlé India’s portfolio is structured under the following main categories:
### **A. Prepared Dishes and Cooking Aids**
* **Brands:** Maggi (noodles, sauces, soups, masalas)
* **Products:** Instant noodles, pasta, cooking aids (e.g., bouillons, seasonings)
### **B. Milk Products and Nutrition**
* **Brands:** Nestlé Everyday, Nestlé a+
* **Products:** Milk powders, dairy whitener, curd, milk-based beverages
### **C. Beverages**
* **Brands:** Nescafé, Nestea
* **Products:** Instant coffee, iced tea, ready-to-drink beverages
### **D. Chocolates and Confectionery**
* **Brands:** KitKat, Munch, Milkybar, Bar-One
* **Products:** Chocolates, wafers, candies
### **E. Nutrition and Health Science**
* **Brands:** Lactogen, Cerelac, NAN, Nestlé Health Science
* **Products:** Infant nutrition, baby food, dietary supplements
---
## **4. Customer Segments**
* **Urban & Rural Consumers:** Varied SKUs to cater to different income levels
* **Children & Adolescents:** Chocolates, milk-based products
* **Young Adults:** Convenience foods (Maggi, Nescafé)
* **Parents & Infants:** Infant formula, baby food
* **Health-conscious Individuals:** Nutritional supplements, low-fat products
---
## **5. Channels (Distribution Model)**
### **A. General Trade**
* Kirana and local retail stores
* Largest channel for rural and semi-urban areas
### **B. Modern Trade**
* Supermarkets, hypermarkets (Reliance Fresh, Big Bazaar, etc.)
* Focused on premium product placement
### **C. E-Commerce**
* Platforms: Amazon, BigBasket, Flipkart, Blinkit
* Direct-to-consumer through Nestlé’s online channels
### **D. Out-of-Home Consumption**
* Coffee vending machines, foodservice partnerships (cafés, offices, hotels)
---
## **6. Key Activities**
* Product R\&D and innovation tailored to Indian preferences
* Brand promotion and advertising
* Manufacturing, packaging, and distribution
* Quality assurance and compliance
* Health and nutrition awareness campaigns
---
## **7. Key Resources**
* Manufacturing Plants (9 factories in India – Punjab, Goa, Karnataka, etc.)
* Human capital (technical experts, nutritionists, management)
* Global R\&D support from Nestlé S.A.
* Robust supply chain and distribution network
* Digital platforms and consumer analytics
---
## **8. Revenue Streams**
Nestlé India generates revenue through the **sale of its consumer products** in domestic and export markets.
Breakdown of revenue by category (approximate figures):
* Prepared Dishes & Cooking Aids (e.g., Maggi): \~30–35%
* Milk Products & Nutrition: \~40–45%
* Beverages (e.g., Nescafé): \~10–15%
* Confectionery: \~10%
---
## **9. Cost Structure**
* Raw materials (milk, wheat, sugar, cocoa, packaging materials)
* Marketing and brand promotions
* Manufacturing and logistics costs
* R\&D and product development
* Employee salaries and benefits
---
## **10. Partnerships**
* Parent company (Nestlé S.A.) for innovation, global branding, R\&D
* Third-party logistics and supply chain partners
* Retail and distribution partners (wholesalers, retailers, e-commerce)
* NGOs and government agencies for nutrition-related CSR initiatives
---
## **11. Sustainability & CSR Initiatives**
Nestlé India is deeply committed to sustainability and social responsibility through:
* **Water stewardship** in manufacturing
* **Plastic waste management and recycling** programs
* **Project Jagriti** – Nutrition education for adolescents and mothers
* **Farmer Connect Program** – Supporting rural dairy farmers
* **Reducing carbon footprint** and improving energy efficiency
---
## **12. Competitive Advantage**
* Iconic, trusted brands like Maggi and Nescafé
* Deep understanding of Indian food culture
* Strong innovation pipeline and adaptation to local tastes
* Nationwide distribution reach
* Backed by global R\&D and financial strength of Nestlé S.A.
---
## **13. Challenges**
* Regulatory scrutiny in food safety and labeling (e.g., Maggi crisis in 2015)
* Rising raw material and operational costs
* Competitive pressure from local and global FMCG players (e.g., ITC, HUL, Amul, Britannia)
* Changing consumer preferences toward healthier options
---
## **14. Growth Strategies**
* Expanding presence in rural and Tier 2/3 markets
* Launching health-focused and plant-based products
* Strengthening digital and e-commerce channels
* Enhancing supply chain sustainability and efficiency
* Localization of global innovations (e.g., new product variants of Maggi or KitKat)
---
## **15. Business Model Canvas (Summary)**
| **Key Partners** | **Key Activities** | **Value Proposition** | **Customer Relationships** | **Customer Segments** |
| ------------------------------------------------------ | ----------------------------------------- | ---------------------------------- | --------------------------------------------------- | ---------------------------------------------------------- |
| Suppliers, retailers, logistics, R\&D from Nestlé S.A. | Manufacturing, R\&D, marketing, logistics | Nutritious, tasty, affordable food | Brand loyalty, direct feedback, digital touchpoints | Consumers (urban, rural, infants, youth, health-conscious) |
| **Key Resources** | **Channels** | **Cost Structure** | **Revenue Streams** |
| -------------------------------------------- | ---------------------------------------------- | ----------------------------------------- | ------------------------------------------ |
| Factories, brands, workforce, parent company | Retail (GT & MT), e-commerce, D2C, foodservice | Raw materials, logistics, marketing, R\&D | Product sales (food, beverages, nutrition) |
---
Thanks & Regards
For More Charts Study Follow Us On Social Media Platforms
The Golden Farms of Equity

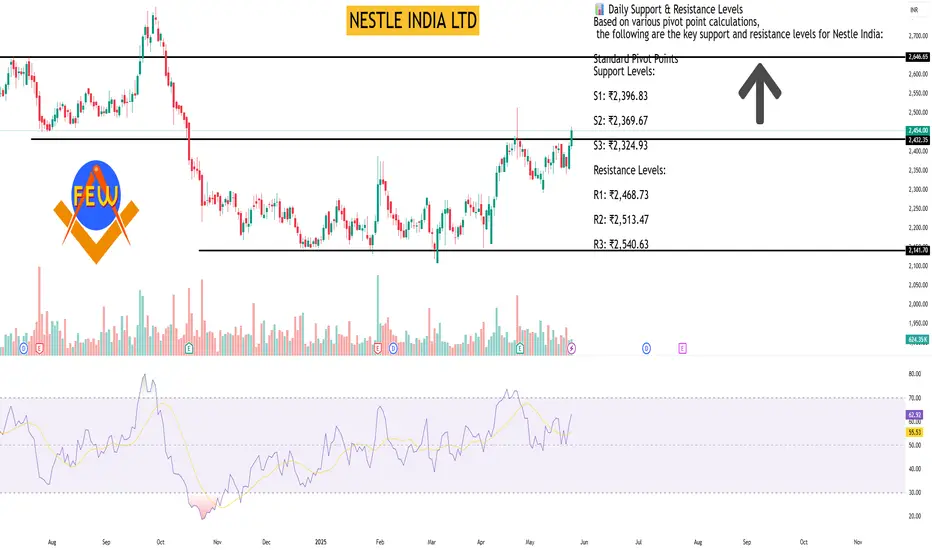
NESTLE INDIA LTDAs of May 26, 2025, Nestle India Ltd. (NSE: NESTLEIND) closed at ₹2,451.00, marking a 1.52% increase from the previous day. The stock's intraday range was between ₹2,405.40 and ₹2,464.90.
📊 Daily Support & Resistance Levels
Based on various pivot point calculations, the following are the key support and resistance levels for Nestle India:
Standard Pivot Points
Support Levels:
S1: ₹2,396.83
S2: ₹2,369.67
S3: ₹2,324.93
Resistance Levels:
R1: ₹2,468.73
R2: ₹2,513.47
R3: ₹2,540.63
Fibonacci Pivot Points
Support Levels:
S1: ₹2,396.83
S2: ₹2,369.37
S3: ₹2,352.40
Resistance Levels:
R1: ₹2,424.30
R2: ₹2,441.27
R3: ₹2,468.73
Camarilla Pivot Points
Support Levels:
S1: ₹2,407.81
S2: ₹2,401.22
S3: ₹2,394.63
Resistance Levels:
R1: ₹2,420.99
R2: ₹2,427.58
R3: ₹2,434.17
📈 Technical Indicators Overview
Relative Strength Index (RSI): 70.998 — approaching overbought territory.
MACD (12,26): 17.89 — bullish crossover.
Stochastic Oscillator (9,6): 85.134 — overbought.
Average Directional Index (ADX): 56.86 — indicating a strong trend.
Moving Averages: The stock is trading above its 5-day (₹2,454.78), 10-day (₹2,436.91), 20-day (₹2,405.42), 50-day (₹2,397.91), 100-day (₹2,374.14), and 200-day (₹2,381.37) simple moving averages, suggesting a strong upward momentum.
🔍 Summary
Nestle India Ltd. is exhibiting strong bullish momentum, trading above key support levels and moving averages. However, technical indicators like RSI and Stochastic Oscillator suggest that the stock is nearing overbought conditions. Investors should monitor these levels closely for potential pullbacks or consolidations.
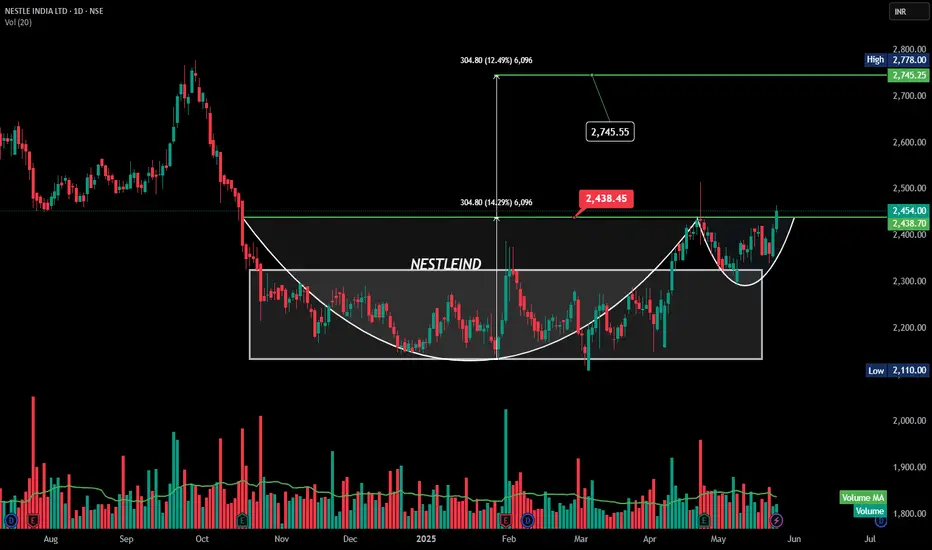
NESTLEIND |Cup & Handle Breakout | DailyThis chart of **Nestle India Ltd** shows a **Cup and Handle** breakout pattern — a strong bullish continuation signal.
---
### 🟢 **Cup & Handle Breakout – Nestle India Ltd**
#### **Pattern Highlights:**
* **Cup Formation:** Long rounding bottom from Nov 2024 to April 2025.
* **Handle:** Minor consolidation and dip in May 2025.
* **Breakout Point (Neckline):** ₹2,438.45
* **Target Projection:**
Height of cup ≈ ₹305
📈 Target = ₹2,438 + ₹305 = **₹2,745** (marked)
### ✅ Key Takeaways:
* **Breakout is with volume**, confirming strength.
* **Next resistance zones**: ₹2,745.60 and ₹2,768.60.
* **Supports post-breakout**: ₹2,438 (neckline).
Would you like a full YouTube-ready set (title, description, tags, disclaimer) for this chart as well?
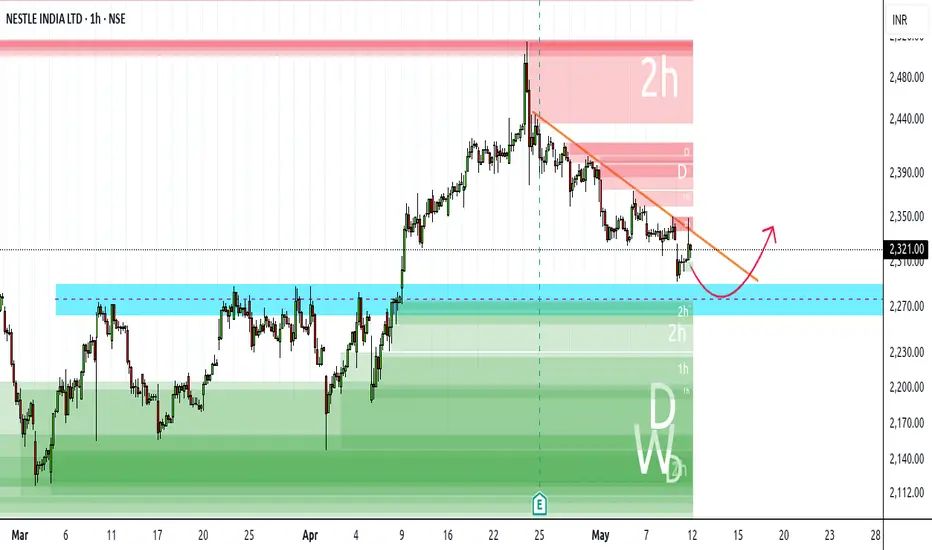
NESTLE INDIA LTDNestle India - Don't Miss the opportunity
Stock currently in downtrend in every time frame
But finally approaching its strong support level
Which is a demand zone in multiple time frame as well as a flip zone too
Buying zone can be between 2270 - 2290 with strict SL below 2260 closing basis
(at least in hourly candle)
Upside 1st tgt can be at least 2400 and so on
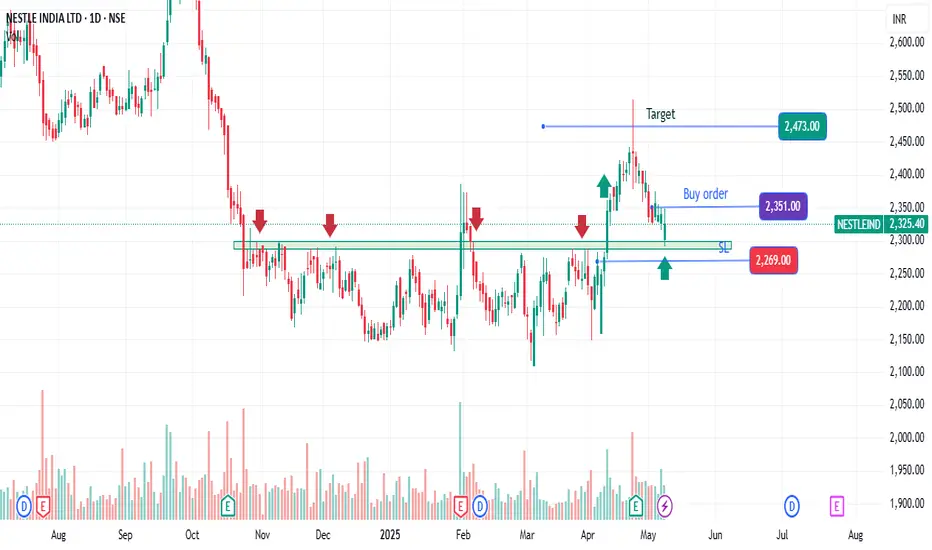
Nestle India: Multiple times resistance and Breakout and retestNSE:NESTLEIND
Resistance becomes Support !
This has shown multiple times resistance levels see the red arrows on chart, on 9th Apr 2025 script has shown the breakout with increased volumes, on 09th May script has shown the Bullish candle at the previous resistance level which will work has support.
Buy above the high of Bullish candle at 2351
SL at 2269
Target at 2473.
Nestle India - Don't Miss the opportunityStock currently in downtrend in every time frame
But finally approaching its strong support level
Which is a demand zone in multiple time frame as well as a flip zone too
Buying zone can be between 2270 - 2290 with strict SL below 2260 closing basis (at least in hourly candle)
Upside 1st tgt can be at least 2400 and so on
Nestle - Expecting a reversal from Demand Zone!➡️ Price Analysis & Overview:
1️⃣ Price has been respecting the channel.
2️⃣ The price has now reached a strong demand zone, increasing the likelihood of a reversal.
3️⃣ Risk-reward ratio looks promising, but stronger moves can be anticipated only above ₹2500, provided the stock holds higher levels.
4️⃣ The FMCG sector overall seems primed for a reversal, adding strength to this setup.
✨ My Plan:
1️⃣ An aggressive entry can be considered at the CMP.
2️⃣ Conservative traders may wait for confirmation above ₹2500 for momentum trades.
3️⃣ SL 5%
4️⃣ TP at 10% and TP2 at 20%, depending on price action.
⚠️ Disclaimer: This is NOT a buy/sell recommendation. This post is meant for learning purposes only. Views are personal. Please, do your due diligence before investing.⚠️
💬 Drop your thoughts below in the comments section if you liked this analysis!✌️
🔥Happy trading!⚡

NESTLE is looking good, but it need observationNESTLE Is looking good, if it sustains above 2340, then definitely it will move above to break his all time high, so watch it observe it

NESTLEIND // 25-02-2025This share may give 6% Profit. Take position as per your risk reward ratio and that is not recommended, only for educational purposes.

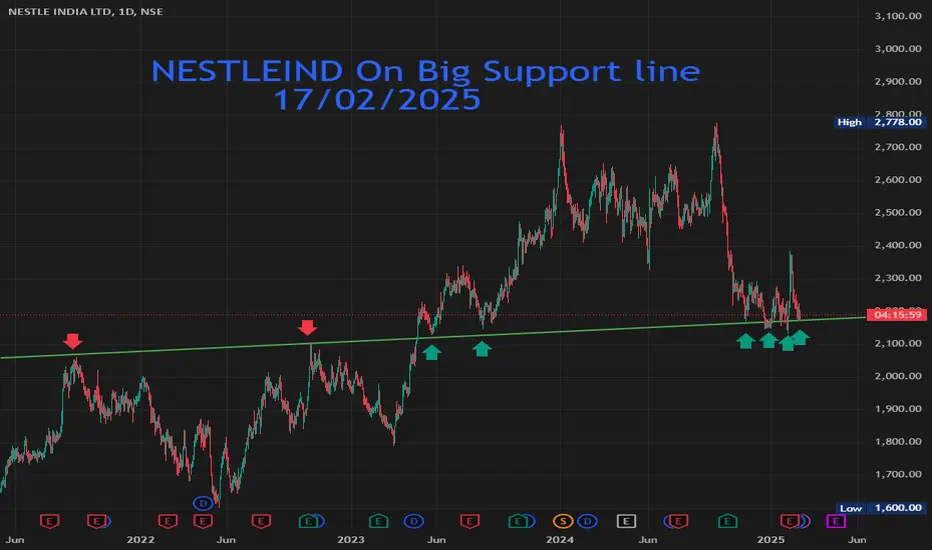
NESTLEIND On Big Support line 17/02/2025TIMEFRAME : DAILY , EXCHANGE : NSE INDIA , SYMBOL : NESTLEIND First time 14/09/2021 resistance created high 2060 second time 19/10/2022 high 2100 this tow point created line convert support 25/05/2023 . Then five times hit the support line. Last five month NESTLEIND tread on this line near.
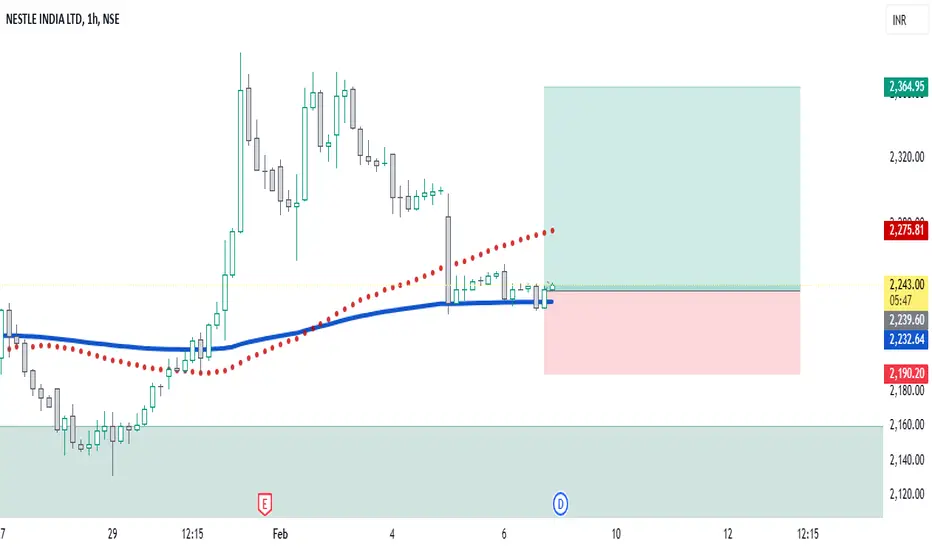
NESTLEY POSITIONAL TRADINGSwing Trading 06-02-2025
Entry : 2239, Stop : 2190, Target : 2365
Rsi-14, 40 reversal setup.
Education purpose only - NestleStock has rebounded from D20EMA
It should head to W20EMA 2300 than to M20EMA 2330
and if this crosses than it is in a strong momentum

[Intraday | Swing] NESTLEINDNESTLEIND seems to be consolidating allow EQL
A cautious long can take around 2150.
Keep strict SL.

Nestle India: 3 Drive Bullish Reversal with RSI Divergence!Observations:
1. Support Zone:
Price is trading at a significant horizontal support zone around ₹2,160–₹2,200.
Historical price action shows multiple instances of price respecting this level as strong demand.
2. Three-Drive Accumulation Pattern:
A clear "Three Drive" pattern is visible, indicating accumulation at this support level.
This pattern often precedes a bullish reversal.
3. RSI Divergence:
Bullish divergence on the RSI: Price made lower lows while RSI made higher lows, indicating a weakening bearish momentum.
Confirmation:
Monitor price action for bullish candlestick patterns or a significant increase in volume on breakout.
