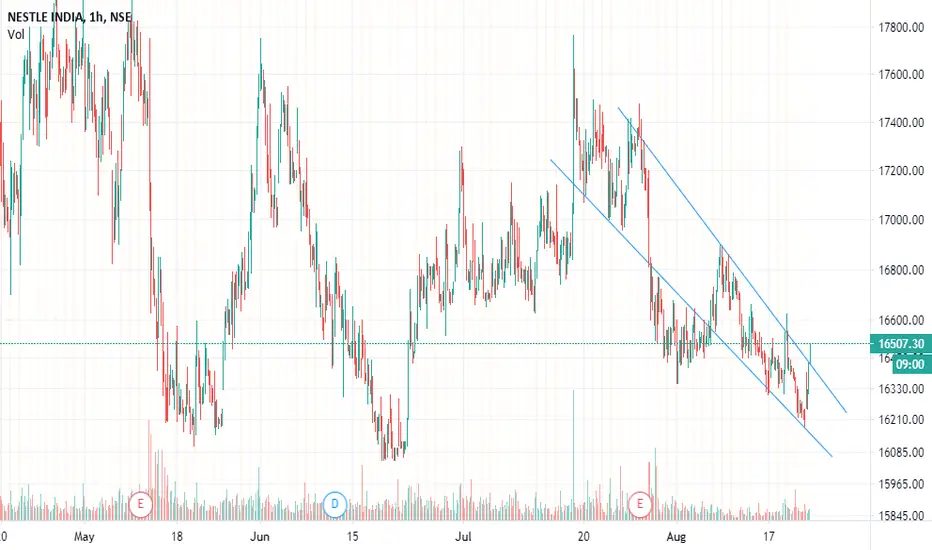
NESTLEINDIA respect support buy above 16500 TGT - 16900/17200/17NESTLEINDIA
respect support
buy above 16500
TGT - 16900/17200/17500
SL - 16000(WCB)
NESTLEIND trade ideas


NESTLEIND: Should be a buy if everything is right with market.NESTLEIND is in descending triangle pattern and along with MACD divergence.

NESTLEIND : Trade SetupNSE:NESTLEIND
Hi Traders,
NESTLEIND is on support level. If this support is broken by it then it will start downward movement and if it will reverse and move above previous high then will try to move upward direction.
Entry and target level on chart.
**********************************************************************************************************************************
If it is helpful for you, please show your support and hit the LIKE button.
Provide some feedback below in the comment!
This would give us encouragement to keep sharing our ideas here on this platform.
###Learn To Earn###
* This analysis is educational/learning purpose only.
* Trade at your own risk.
Trade well,
**********************************************************************************************************************************

Buy after break out...the price is trading inside the channel,where the total pattern looks like bullish flag.where the potential of price can move further upward direction.do follow me for more update...cheers


Synergistic Pattern: Advance pattern (W+Flag) + Support MA 200Levels are mentioned on chart for Swing trading.
Please check the description section for early entry level in given stock to get better Risk to Reward ratio.
Kindly like & share this pattern. Comment with what do you think.
Follow me @ tradingview for more updates!!!
Entry: 16450
SL: 15950
Target: 17450/ 18200
RR: 2.0/3.5
Thank you. Happy Trading!!!
Best Regards,
Dr. Shamraja Nadar,
PhD in Technology.
Disclaimer
--------------------------------------------------------
All investments involve risk, and the past performance of a security, industry, sector, market, financial product, trading strategy, or individual’s trading does not guarantee future results or returns. Investors are fully responsible for any investment decisions they make. Such decisions should be based solely on an evaluation of their financial circumstances, investment objectives, risk tolerance, and liquidity needs.
---------------------------------------------------------

Nestle India - Fake Breakdown reversal @ 16287Nestle India has given a fake breakdown reversal alert @ 16287. One can go long with a stop loss of Rs. 15870

NESTLEIND -- daily chartNestleind in range now on daily time frame hope show up side movement
wait for update


bearish triple top and double bottom on Nestlesell with stoploss of 16150
and target of 15000
after reaching 15000 may go bullish


NESTLEIND can potentially gain strengthThis analysis requires more confluences, will update soon.
Please do your own research before trading or investing.


Nestle Ind trade idea for Intraday ShortTRADE IDEA FOR INTRADAY
levels are on the chart,
as its intraday, these levels are for today only.

Nestle indiaBeautiful breakout retest , results om tuesday good volumes good candidate for buy
Great risk reward ratio NSE:NESTLEIND

NESTLEINDIA ANALYSIS 17.08.2020IN WEEKLY IT IS IN 16354 PROPER SUPPORT . ONCE IF IT BREAK 16354 THEN WAIT AND WATCH WHERE IT IS OPENING.IF NOT BREAK MEANS GO FOR BUY .
BUY 16354
TARGET 16587 TO 1800
IF IT OPEN IN GAP DOWN BUY AT
BUY 16161 TO 16020
TARGET 16720
WAIT AND WATCH FOR BETTER CONFORMATION.BECAUSE IT IS IN SIDE WAY.


NESTLEIt appears bearish in mutli time frames
Weekly - Ichimoku C Clamp
Daily - Crown Pattern
Hourly - Rounding Pattern
It could retest 16000/15300. View negates above 16900

SELL NESTLEIND 16700-16710 SL 16800 TG 16600-16500SELL NESTLEIND 16700-16710 SL 16800 TG 16600-16500....Lot size is 50....it's spot price adjust accordingly in future

Nestle India Ltd. - WEEKLY CHARTNestle India Ltd. taking support at the lower line of the symmetrical triangle pattern and probable support on the downside comes at 16350-16550 zone.
RSI too taking support from 50 level suggesting underlying positive bias in the stock.
Breakout in the stock to take place above swing high of 17770.
Keep a watch.
FOR COMPLETE STOCK ANALYSIS, INTRADAY LEVELS AND FOLLOW-UP. CONTACT ME!!
