OLAELEC Price ActionOlectra Greentech Ltd (OLAELEC) posted a strong performance today, trading around ₹1,390 with a notable upward move. The stock has been on a bullish trajectory over the past week, rebounding from its recent support near ₹1,350. Short-term moving averages indicate continued positive momentum, with the price well above both the 20- and 50-day averages.
Technical indicators like RSI suggest mild overbought conditions, confirming robust buying interest but also signaling potential consolidation if the stock fails to hold above its current highs. The immediate resistance zone lies near ₹1,420, while strong support is seen at ₹1,350. A sustained breakout above resistance could propel the stock towards ₹1,500 in the coming sessions, whereas a slip below support may lead to a short-term pullback.
Overall, OLAELEC is showing solid relative strength, buoyed by expectations of new contracts and strong demand in the electric vehicle bus segment. Market sentiment remains positive, but traders should be wary of profit booking near resistance. The short-term outlook stays bullish as long as the price holds above its key support levels.
OLAELEC trade ideas

OLA looks good for higher levelsLooks like OLA has started rising from the ashes... SL near 46 may be a good idea where maximum volumes hv happened.

OLAELEC Price ActionOla Electric Mobility Ltd is trading around ₹58.34 as of September 10, 2025. The stock has fluctuated between ₹57.40 and ₹60.79 through the session, with a previous close of ₹59.83. Market capitalization is approximately ₹25,700 crore. The share price has faced significant volatility, falling from a 52-week high of ₹123.90 down to a low of ₹39.60, and remains well below its all-time high.
Financially, Ola Electric continues to operate at a loss, reporting a negative trailing twelve-month EPS of -₹5.34 and an ROE of -108%, indicating unprofitable operations despite firm topline revenue. Annual net sales for FY25 are ₹4,514 crore, but operating profit and net profit remain negative due to heavy ongoing investments and interest expenses.
Key metrics on the balance sheet highlight low leverage (debt-to-equity ratio of 0.59) and a book value per share of ₹14.90, but the stock trades at 3.92 times its book value, indicating that valuation is stretched relative to fundamentals. No dividend has been declared, and recent large block stake sales from major investors have caused additional price swings.
Technically, Ola Electric is trading near its 20-day VWAP and remains highly liquid, with daily average trading volumes above 30 million shares. Momentum is subdued, and the near-term price action suggests more downside risk if selling pressure persists, with support seen near ₹55 and resistance close to ₹62. The outlook depends on the company’s ability to reverse losses and capitalize on India’s EV market growth amid challenging competitive and financial conditions.

Ola electric : Re entry opportunity Taking support.
Can re enter .
S loss can be 10% ..Long term stock .
Can generate generational wealth

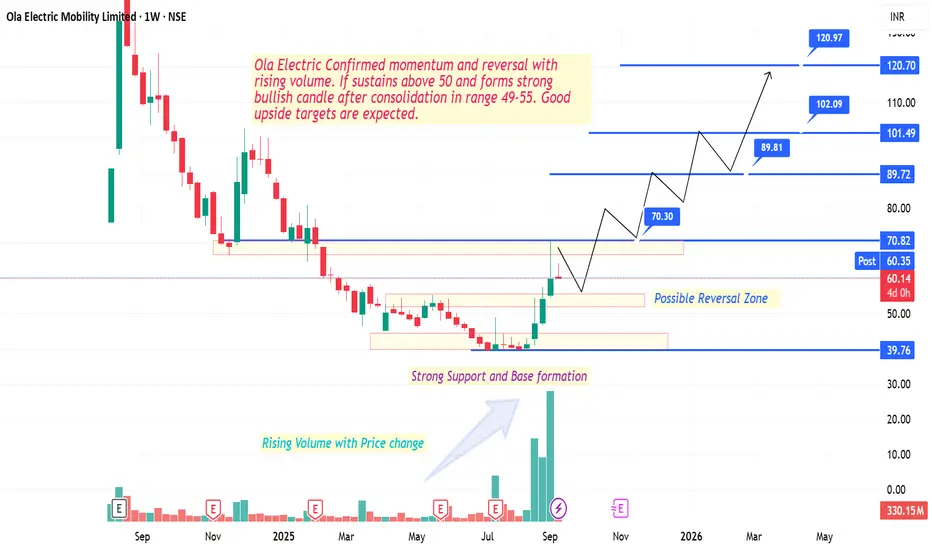
Ola Electric Mobility Limited – Weekly Chart AnalysisOla Electric has shown confirmed momentum and reversal with rising volume. After a long consolidation phase between ₹49–55, the stock has broken out with strong bullish candles, supported by heavy volumes – signaling a possible trend reversal.
🔹 Key Technical Observations
✅ Strong base formation and reversal zone around ₹49–55
✅ Rising volumes confirming price momentum
✅ Sustaining above ₹50 adds bullish strength
✅ Next resistance levels:
₹70.30 / ₹70.82
₹89.72 / ₹89.81
₹101.49 / ₹102.09
₹120.70 / ₹120.97
📈 If momentum continues and price sustains above ₹60–65 levels, higher targets can be achieved step by step.
⚠️ Risk Management:
Keep strict stop loss below ₹49 zone (support base) or as per your risk management. Previous swing low is preffered for long term investors.
Partial profit booking near resistance levels is advisable.
Re-entry possible on retest of breakout zones.
#OlaElectric #NSEStocks #MomentumTrading #PriceAction #BreakoutStocks #VolumeAnalysis #StockMarketIndia #SwingTrading #ReversalSetup #TradingViewIndia
Ola Electric Mobility Ltd.Ola Electric Mobility Ltd.
Price Information
52 Week High (18-Sep-2024) 123.90
52 Week Low (14-Jul-2025) 39.60
Upper Band 74.35
Lower Band 49.56
Price Band (%) 20
Daily Volatility 3.60
Annualised Volatility 68.78
Tick Size 0.01
Securities Information
Status Listed
Trading Status Active
Date of Listing 09-Aug-2024
Adjusted P/E NA
Symbol P/E NA
Index NIFTY MIDCAP 150
Basic Industry 2/3 Wheelers.

Uptrend in OLA. broken resitance1.) Resistance has broken with huge buying volume
Good for swing upward move
2.)Follow strict stop loss with targets
3.) technically good if fundamentals get strong then good for long term with 130 to 140 levels.

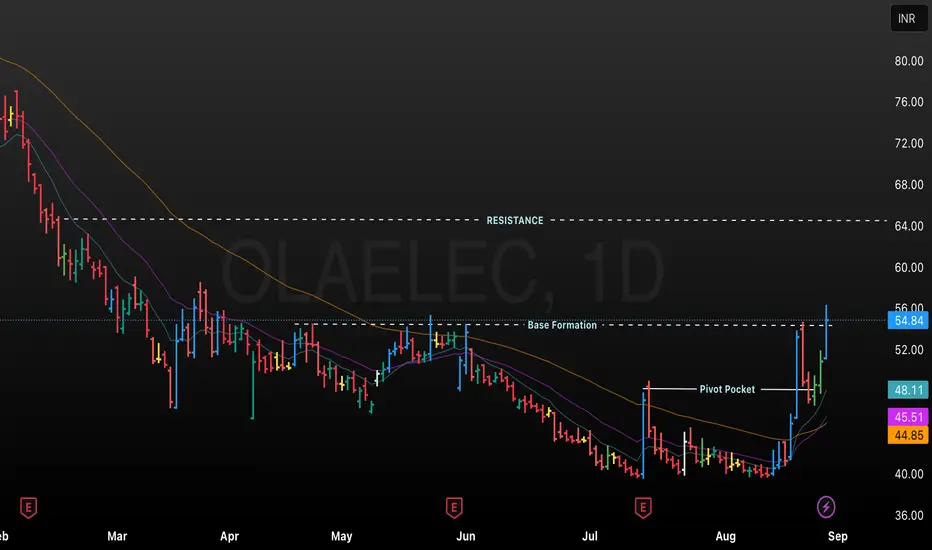
OLA ELEC, 1D — Daily OLA Electric Stock Price ChartThis chart displays the daily candlestick price action for OLA Electric, showing trends from February to August. Key technical levels are annotated, such as Resistance near 64, a Base Formation region, and a Pivot Pocket, indicating areas of price consolidation and breakout attempts. Moving averages (possibly 20-day, 50-day, and 200-day) are included, and the latest price is 54.84 INR, with a significant gain of +7.91% on the day. The chart is useful for analyzing support, resistance, and trend development in OLA Electric’s stock
Ola electric: matched our Stock analysisOla will soon hit the next level : 63.5.
Weekly candle shows strength and good momentum.
Trend is intact and trend resistance lines are now support, so keep trailing with the momentum.
Fibonacci levels are also supporting.
Follow the cbsl of 40 as mentioned in previous post, and trail the target 🎯 64.
Keep adding around 45..48.

OLA Electric (Daily Timeframe) - Potential Bullish BreakoutOLA has been on a downtrend ever since it's IPO and recently it has shown signs of a reversal . Past few days, the stock has been attempting to Break-Out a major resistance multiple times, as indicated. Today it was able to breach the resistance with huge volume. The next few trading sessions will indicate the stock's trend.
Possible targets are, 62 & 80 if the stock sustains the uptrend.
To be monitored !!!
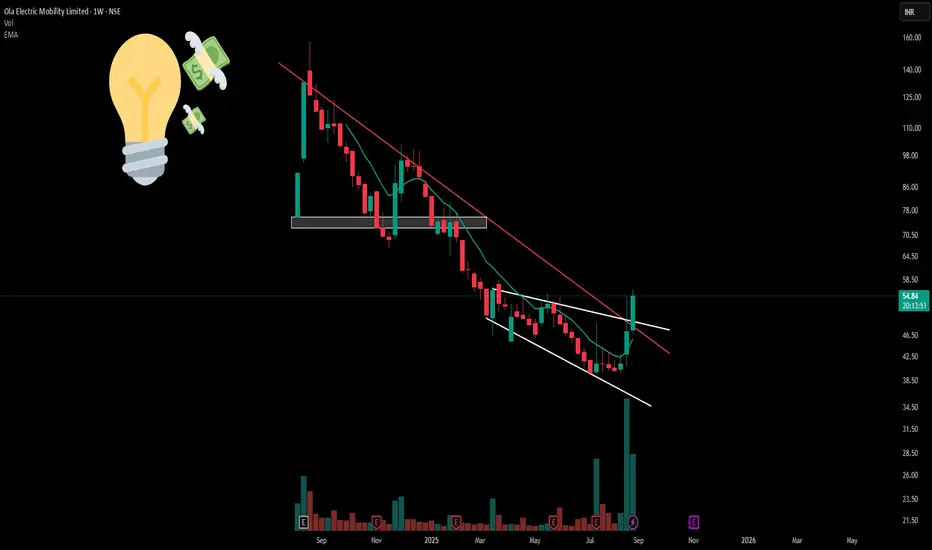
OLA : Simple Channels and Exceptional Volume PatternsOla Electric (NSE: OLAELEC) displays a descending channel pattern with the red resistance trendline providing consistent overhead resistance. The stock has operated within this falling channel structure since peak levels, creating defined technical boundaries.
A broadening formation is evident through white trendlines showing expanding volatility ranges.
Exceptional volume expansion compared to historical averages. Combined NSE+BSE volumes substantially exceed normal ranges, indicating institutional participation rather than retail activity.
Disclaimer: Educational content only. Not investment advice. Trading involves substantial risk. Technical patterns don't guarantee outcomes. Consult qualified advisors before investing.
OLA Baloon is BrustLast 2 Days rally of the Ola Share Today is brust the price is going to up because of the strong PR and company is giving the strong guidense of the Upcoming days, but as per the fundamental of company and result is not showing this, this company is currently in the loss making, company is loss market share and high competition this share is major concern,
Now but this all things is discount in the price, if you are sure this company us survive this situation you can buy for the long term, But short term this give pain for the portfolio

Update on: Ola electric matched the analysis and pattern levelsPerfect Entry timing 🚀 We catch it-:
Update on the Ola Electric (Weekly Chart Analysis) considering today’s price action hitting ₹53.79, which matches the earlier highlighted resistance zone (~₹54.2).
Ola Electric – Weekly Chart & Fundamentals (Updated)
Technical Analysis (Weekly Chart)
CMP (Current Price): ₹53.79 (+5.5%)
Trend: After a long downtrend since IPO (~₹120), the stock has finally shown breakout strength from its falling wedge pattern.
Price Action:
Broke above ₹46.3 immediate resistance last week.
Now tested ₹53.7–₹54.2 supply zone, exactly as forecasted earlier.
Key Support Levels
₹46.3 (now a strong support after breakout)
₹41 (medium-term support)
M
₹39 (long-term base support)
Key Resistance Levels
₹54.2 (tested today – short-term hurdle)
₹68.3 (next breakout target if strength sustains)
₹106.9 (major long-term resistance zone)
Trading View (Updated):-
Bullish case: Sustained weekly close above ₹54.2 could push stock to ₹68 → ₹100+.
Bearish risk: If it fails to hold above ₹46–47 in coming weeks, pullback toward ₹41–39 possible.
Fundamental Snapshot (No Major Change, Still Critical for Students/Investors)
Market Cap: ~₹36,000 Cr
Revenue (FY24): ~₹5,000 Cr (+35% YoY growth)
Profitability: Still loss-making (negative net margins).
Valuations: P/E N/A (loss-making), P/B ~6–7 (expensive vs traditional auto).
Debt-to-Equity: Moderate, backed by IPO proceeds.
Growth Drivers: Strong EV adoption, govt. subsidies (FAME II, state EV policies).
Risks:
High cash burn & uncertain profitability timeline.
Competition from Tata Motors EV, TVS, Bajaj, Ather.
Policy dependence – subsidy withdrawal could hurt margins.i
Conclusion (Updated)
Short-Term (Chart View): Ola has successfully tested ₹54 resistance. Sustained close above this can trigger fresh rally toward ₹68–70 zone.
Medium-Term (Investment): Stock turning positive on technicals, but fundamentals still weak due to losses. Needs visible path to profitability.
Long-Term (5–7 years): Ola has potential to disrupt EV space, but high valuation + risk of dilution + competition makes it a high-risk, high-reward bet.
👉Disclaimer:
This analysis is for educational purposes only. It is not financial advice or stock recommendation. EV stocks are highly volatile, and loss-making companies carry higher risk. Always consult a SEBI-registered advisor before investing.
OLA electric mobilityAfter iPo ola company share price has been dropping and making continuous lower low
but i thing down fall from here will be restricted as institution are buying by big volumes as you can see in this chart therefore recent spike on RSI you could able to see so I thing for value investor this company share price is going to be turnaround as recent interview of ola's promoter Showes how company is working in its vertical integration strategy so i think if you as an investor have some money for 5 yr or so then you can put it in this share as it is going to be multibagger in coming days for knowing more you can see our YouTube channel
at @Akashkashyap98

Ola Electric - stock analysis: updateUpdated : In the last analysis,
The support of 39 still working.
As it stays intact we may expect following, combining technical chart view + some key fundamental investing ratios as well-
Technical Analysis (Weekly Chart)
Current Price: ₹41.31 (+2.00%)
Trend: Stock has been in a steep downtrend since listing (from near ₹120 levels). Recently showing signs of base formation around ₹38-₹42.
Chart Pattern:
Price moving in a falling wedge / downtrend channel.
Multiple attempts to break out above ₹46-₹47 resistance.
Long-term bottoming signs visible.
Key Support Levels
₹39 (major base support)
₹35 (breakdown risk below this)
₹30 (worst-case scenario)
Key Resistance Levels
₹46.3 (immediate resistance)
₹54.2 (supply zone)
₹68.3 (medium-term breakout target)
₹106.9 (long-term resistance if strong rally sustains)
Trading View:
If price holds above ₹39-41, it can attempt a bounce toward ₹54 to ₹68.
Sustained close above ₹68 may open rally toward ₹100+.
If it breaks below ₹39, risk of further fall toward ₹35-30.
Fundamental Snapshot (as per recent financials of Ola Electric)
Note: Ola Electric is a newly listed company (IPO in 2024), so fundamentals are still stabilizing.
Market Cap: ₹36,000 Cr (mid-cap, growth-oriented).
Revenue (FY24): ₹5,000 Cr (fast-growing, >35% YoY growth).
Profitability: Loss-making (negative net profit margin).
P/E Ratio: N/A (since company is loss-making).
P/B Ratio: 6-7 (high valuation compared to traditional auto companies).
Debt-to-Equity: Moderate, backed by fundraises but needs close watch.
EV Industry Growth: Strong demand push by Govt incentives (FAME II, EV subsidies).
Risk Factors:
Still in cash burn mode, uncertain path to profitability.
Competition from Tata Motors EV, TVS iQube, Ather Energy.
Heavy dependency on Govt policy & subsidies.
Conclusion:
Short-Term (Technical): Stock is near bottom support, bounce possible toward ₹54-₹68.
Medium-Term (Investment): Needs consistent revenue growth + reduction in losses for rerating.
Long-Term (5-7 years): Ola Electric could be a disruptor in EV space, but valuation & profitability risk remains high.
Disclaimer:
This analysis is for educational purposes only and not financial advice. Stock markets are risky, especially with new-age loss-making companies like Ola Electric. Please do your own research or consult a SEBI-registered financial advisor before investing.

Ola electric: extreme down trend and debtOla electric- the stock has been in a long down trend and made it's all time low around 39.60.
Company fundamentals are widely changed post IPO, service concerns and the management is in questionable position. Debt is also concern.
Stock once hit it all time high if 157.4.
I suggest to exit and stay away if the levels break down the line 38.70 Completely exit and stay away

OLAELEC - Bottom fishingOLAELEC: A High-Risk Bottom-Fishing Opportunity from Support
Investment Thesis:
OLAELEC appears to be presenting a high-risk, high-reward "bottom-fishing" trade opportunity. The stock has shown a notable reaction and bounce from critical support levels, indicating potential technical strength at these valuations.
Key Action & Risk Management:
* Maintain a strict Stop Loss (SL) at ₹39. This is paramount to limit downside exposure given the inherent volatility and speculative nature of such trades. Adherence to this SL is non-negotiable.
Outlook & Caveat:
While this setup suggests the potential for significant upside from current depressed levels, similar to sharp recoveries observed in deeply discounted stocks in the past (e.g., some phases of PAYTM's journey from its lows), it is critical to understand the context. Such moves are inherently speculative and do not guarantee similar magnitudes or trajectories.
Important Considerations:
* This is a contrarian play relying heavily on technical bounce from a potential capitulation point.
* Fundamental risks remain high given the company's financial profile. This trade is based on a technical rebound, not a fundamental shift in value.
* The "bottom-fishing" strategy demands exceptional risk management and a clear exit plan.
In summary, OLAELEC offers a speculative trading opportunity for those with a high-risk tolerance, provided the strict stop loss is honored, and expectations are managed regarding the highly unpredictable nature of such high-beta plays.

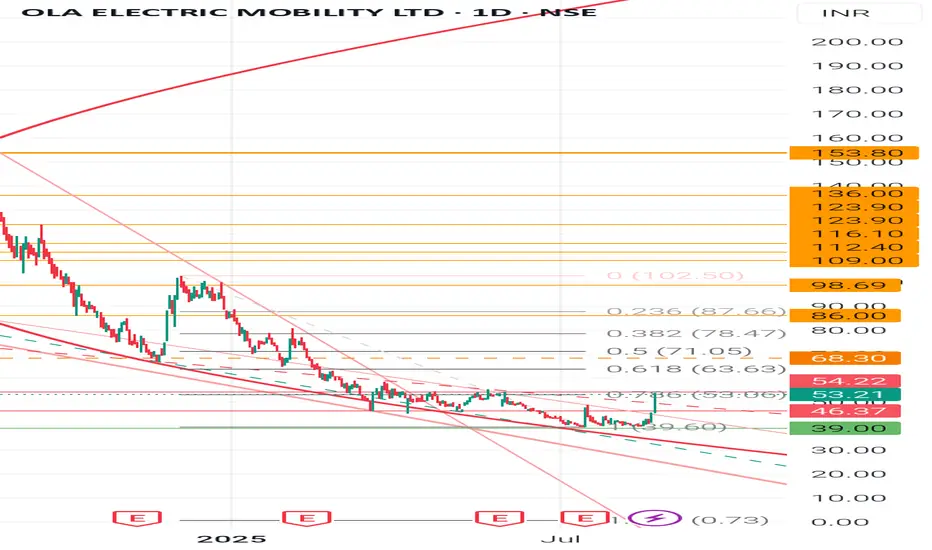
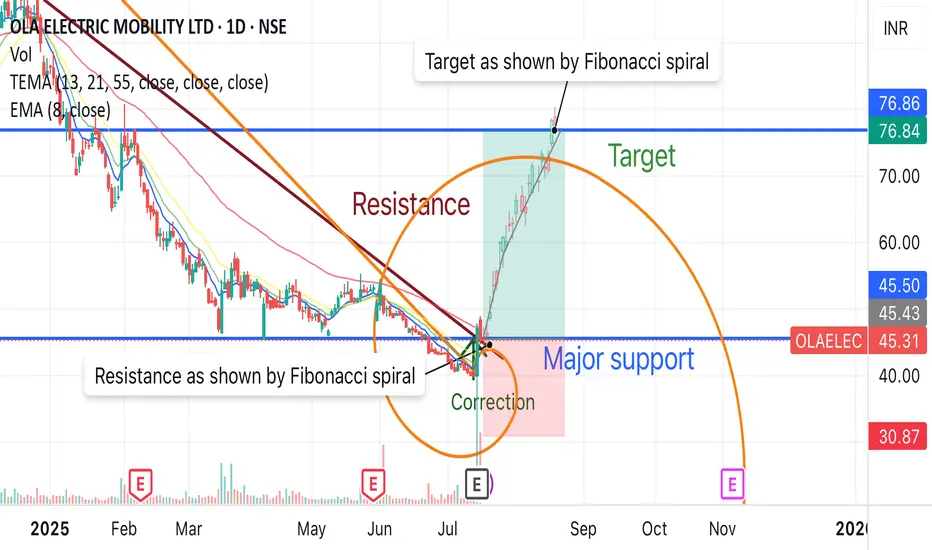
Ola Electric breakout with 65% of upside potential by FibonacciOla electric mobility is going to give 65% of upside with Fibonacci spiral and resistance breakout with high volume.
Buy around - 45 to 47
Target - 76
Duration - 2-3 months
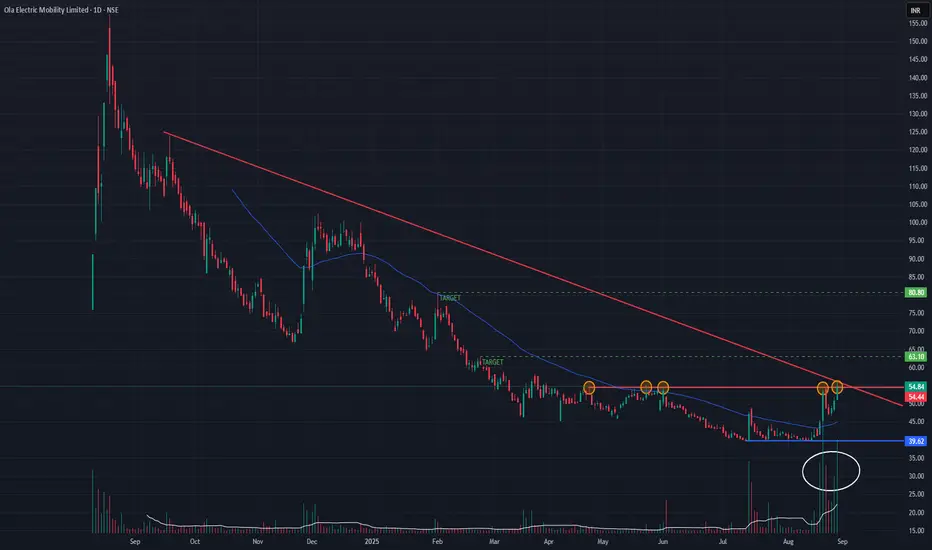
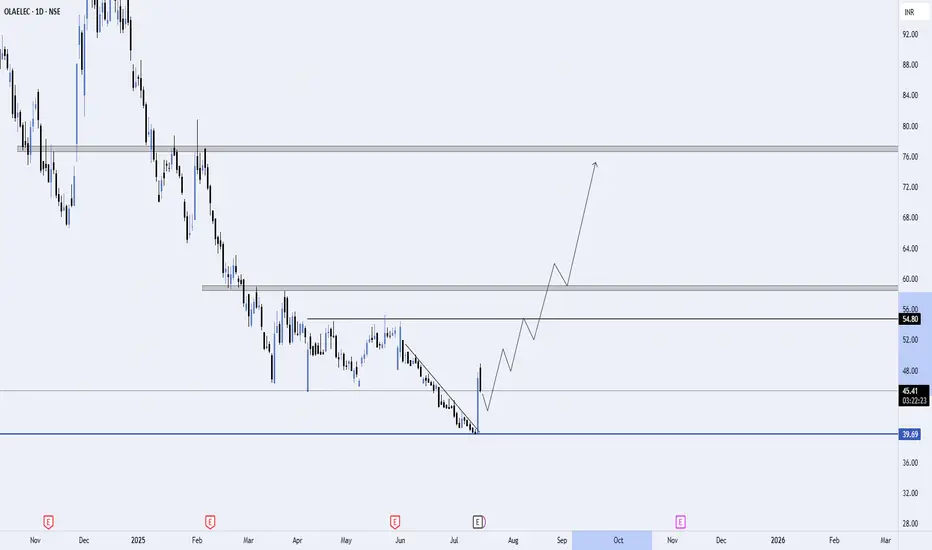
Potential 30% Upside on OLA – Breakout from Downtrend📈 Analysis Overview:
After an extended downtrend, OLA has finally broken out of the descending resistance line with strong bullish momentum. Price action has respected the major support zone around ₹39.69, which has acted as a key demand area in the past.
✅ Key Levels to Watch:
Support: ₹39.69 (strong base)
Intermediate Resistance: ₹45.44 (current retest area)
Targets: ₹54.80 and ₹58.36
Potential Upside: ~31% from current levels
📊 Trade Plan:
Entry Zone: Around current price action, ideally after a minor pullback/retest of the breakout trendline.
First Target: ₹54.80
Final Target: ₹58.36
Stop Loss: Below ₹39.00 to maintain good risk-reward
📈 Rationale:
Clear breakout after prolonged selling pressure
Strong support confirmation near ₹39.69
Volume expansion signals possible accumulation phase
Technical projection shows a potential ~30% upside within the next 3–4 weeks
📝 Note:
This is a swing trade idea based on technical structure. Always manage risk and adapt to market conditions.
Positional Trade with 95% Expected Gain OLA Elec
CMP 80
Add on dips till 70
SL CLB 64
Tgt last High 155 & More
if you like the idea >> Dont miss to boost 🚀
For more info Plz visit my profile & Follow me
Rgds,
Naresh G
Sebi Reg. RA

"All-electric Future. From India. For the world."Ola Electric Mobility Ltd
About
Founded in 2017, Ola Electric Mobility Limited is an electric vehicle company that primarily manufactures electric vehicles and core components for electric vehicles. These components include battery packs, motors, and vehicle frames, all produced at the Ola Futurefactory.
Key Points
Market Leadership Co. is the largest E-Scooter Manufacturing company in India, with 31% market share in the E2W sector, selling 329,618 scooters in FY24.
Product Portfolio
1. Ola S1 Pro: A premium scooter with a 195 km range, 120 kph top speed, and a 7-inch touchscreen.
2. Ola S1 Air: Offers a 151 km range, 6 kW motor power, and a 7-inch touchscreen.
3. Ola S1 X+: A budget-friendly model with a 151 km range, keyless unlock, and a 5-inch display.
4. Ola S1 X: Mass-market scooters with up to 190 km range, available in 2 kWh, 3 kWh, and 4 kWh battery options, with a 3.5-inch display.
⚡ Ola Electric – Early Signs of Revival?
CMP: ₹41.73 | View: High-Risk Accumulation | Timeframe: Daily Chart | Sector: EV
🛵 Technical View:
Ola Electric has been in a steady downtrend since its listing but now showing signs of base formation near ₹40.
MACD on multiple settings is flattening and attempting crossover.
RSI has bounced from oversold zones and moving upward.
ADX/DMI showing reduction in negative strength – trend reversal possible.
Ichimoku cloud flattening – early signal for sideways to positive shift.
🔹 Key Price Levels:
🔸Support: ₹38.5 – ₹40
🔸Breakout Zone: ₹44.5 – ₹47
🔸Resistance: ₹51.5 / ₹60
📊 Volume:
Gradual rise in volumes with sideways consolidation. First green daily candle after long lower highs.
🔍 Fundamentals & Progress:
From Screener:
Not yet profitable, but business is capital-intensive and scaling.
Valuations currently not attractive, but price is near listing lows, making risk-reward favorable for high-risk investors.
🚀 Company Developments:
✅ Ola is rapidly expanding its EV scooter sales & showroom network
✅ Ola official site: Announced upcoming electric motorcycles and focus on battery innovation
✅ Government push for EV adoption will benefit Ola long-term
✅ Founder Bhavish Aggarwal aims to build an EV ecosystem (batteries + charging infra + vehicles)
🧠 Why Watch This Stock?
Sentiment may shift as markets look for beaten-down growth stories
Ola has brand recall, scale, and distribution
Any positive update (sales, production ramp-up, JV) can trigger a move
⚠️ Disclaimer:
This is a high-risk idea, suitable only for long-term investors or speculators with risk appetite. Not a recommendation. Do your own research.
📝 Note: Please do your own due diligence. This is not a recommendation, just a view based on charts and fundamentals.
🧠 Disclaimer: For educational and research purposes only. No buy/sell advice.
📝 Chart Purpose & Disclaimer:
This chart is shared purely for educational and personal tracking purposes. I use this space to record my views and improve decision-making over time.
Investment Style:
All stocks posted are for long-term investment or minimum positional trades only. No intraday or speculative trades are intended.
⚠️ Disclaimer:
I am not a SEBI registered advisor. These are not buy/sell recommendations. Please consult a qualified financial advisor before taking any investment decision. I do not take responsibility for any profit or loss incurred based on this content.

Ola Electric: Charging Toward a Bottom or Just Burning Out?From the darling of India’s EV⚡️revolution to a stock that's lost nearly 70% of its value, Ola Electric Mobility Ltd has had quite the ride — and not the smooth kind. But with price approaching critical technical levels and management throwing around words like “EBITDA breakeven,” a big question looms:
Is Ola Electric bottoming out — or is more pain on the road ahead?
📉 The Rise... and the Faceplant
Launched in 2017 with bold ambition, Ola Electric quickly captured market share, becoming India’s #1 e-scooter maker with a commanding 31% grip on the E2W sector. The hype translated to a stock price that once touched ₹158.
Now? It’s chilling at ₹43, down over 70%, and recently hit an intraday low of ₹43.16 after a 6.3% drop on June 23. What triggered that?
➡️ Block deal worth ₹107 Cr — 2.41 Cr shares changed hands at ₹44.
➡️ Earlier this month: ₹731 Cr block trade — Hyundai Motor Company exited.
That’s some heavy institutional shuffling.
📉 Technicals: A Reversal Setup Brewing?
Ola’s chart paints a classic A-B-C Zigzag correction, with Wave C still unfolding. The final leg could be nearing completion based on these clues:
✅ C wave targeting the 1.618 Fibonacci extension — a textbook end zone
✅ Daily RSI showing bullish divergence — a sign of momentum loss in selling
⚠️ But price is still ~60% above that extension level (~₹15.29), so caution reigns
“Ola’s plunge has brought it into its final support shelf.
The real question: will demand step in near the 1.618 extension — or even earlier?”
We’re seeing divergence whispering potential — but the big move is still loading.
🔍 Fundamentals: Great Product, Brutal Numbers
Let’s not sugarcoat it — the financials are as ugly as the technicals are hopeful.
Net loss (FY25) : ₹-2,276 Cr
Revenue YoY : Down 62%
ROE : -108% | ROCE : -28.1%
EPS : -₹5.16
P/B Ratio : 3.7 (expensive for a loss-making firm)
On the bright side:
✅ Debt has been reduced
✅ Guidance says: ₹800–850 Cr revenue + margin expansion + Roadster rollout
Optimism? Sure. Execution? TBD.
👀 Sentiment Shift or Smart Exit?
Public holding rose to 52.14% in Mar 2025.
Meanwhile, Hyundai just noped out with ₹731 Cr worth of shares.
FII & DII stakes are falling.
This leaves retail holding the EV bag — again.
⚖️ The Two-Sided Story
🟢 Bull Case
Strong brand, dominant market share
Reversal signals flashing technically
Management optimism around margin turnaround
🔴 Bear Case
Fundamentals still bleeding
RSI divergence coming too early
Major support (~₹15) still distant
🛑 Final Thoughts
Ola Electric is approaching a key decision point — for the stock and the company. Technically, a reversal setup is forming. Fundamentally, the story still needs a lot of work. If buyers show up before ₹15.29, this could be a rebound play. If not, we may just be coasting toward another breakdown.
Disclaimer: This analysis is for educational purposes only and does not constitute investment advice. Please do your own research (DYOR) before making any trading decisions.

OLAELEC | TIME FOR A REVERSAL? DISCLAIMER: This is NOT a trade recommendation, but my observation. Please do your own analysis before entering any trade.
A potential reversal setup can be seen to be forming in olaelec.
----------------------------------------------------------------
Points to consider:
1. 45 level is a level offering strong rejections of sellers.
2. Good buying seen in the 45-50 range.
3. A HH-HL formation before a breakout attempt of the neckline.
4. A reverse Head & Shoulders pattern can be seen
Keeping these points in mind, a trade can be executed as follows:
Entry CMP, SL 50, Exit 61.5, RR 2.8
Thank you
