Pole and Flag in Paras DefenseParas Defense shows a nice pole and flag chart pattern. It has the highest possibility to move to 860 in the coming week
Next report date
—
Report period
—
EPS estimate
—
Revenue estimate
—
7.95 INR
634.71 M INR
3.65 B INR
36.41 M
About Paras Defence & Space Technologies Ltd.
Sector
Industry
CEO
Munjal Sharad Shah
Website
Headquarters
Navi Mumbai
Founded
2009
ISIN
INE045601023
FIGI
BBG012MSVBH1
Paras Defence & Space Technologies Ltd. engages in the provision of designing, developing, manufacturing, and testing of a wide range of defence and space engineering products and solutions. It operates through the Optics & Optronic Systems and Defence Engineering segments. The Optics & Optronic Systems segment includes Space Optics/Gratings/Mirrors, Infra-Red Lenses for Night Vision Devices, Optomechanical Assemblies and Precision Diamond Turned components etc. The Defence Engineering segment focuses on the Defence Automation & Control systems, Rugged Command & Control Consoles, Avionic suite etc. The company was founded on June 16, 2009 and is headquartered in Navi Mumbai, India.
Related stocks

Paras Defence Technical Analysis🚀 Paras Defence & Space Technologies Ltd – Weekly Chart Analysis
The stock is showing signs of a potential reversal after consolidating near key support zones.
🔎 Technical Observations
Price Action:
After a prolonged decline from the highs, the stock has stabilized around the ₹640–660 support regi
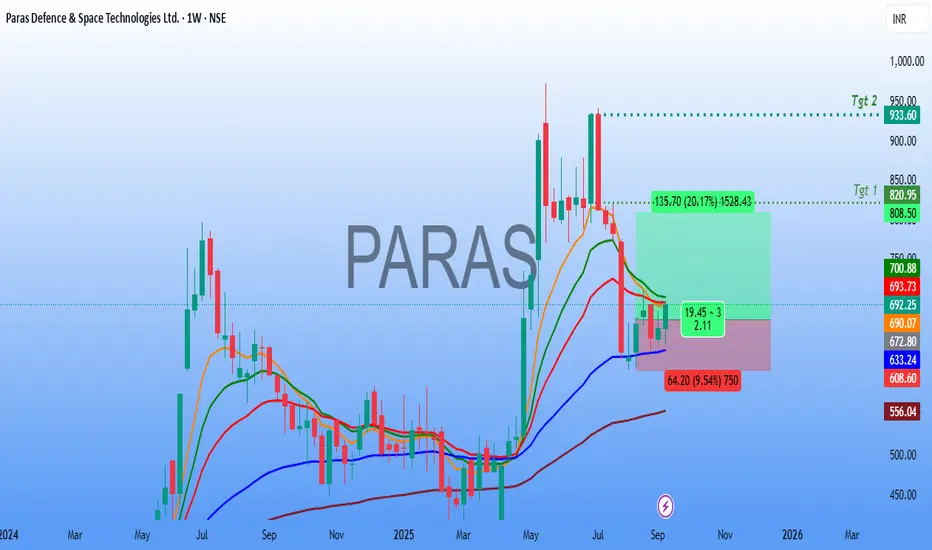
PARAS LONG Beautiful liquidity swap done, suggesting a big move to the buy side.
Market two targets with strict SL.

PARAS Stock Analysis: Demand & Supply Zones, Base FormationThis TradingView chart of PARAS (Electronic Technology – Aerospace & Defense) highlights structured price action between demand and supply zones for 2025. Key features include a 110-day base, sound base formation, resistance at the 50 EMA, and marked demand/supply areas. The chart also presents curr

Paras Defence Price ActionParas Defence and Space Technologies is currently trading near ₹1,630, having delivered a substantial rally over the past year and outperformed many of its peers in the defence sector. The stock has risen more than 100% from its 52-week low and is trading close to its all-time high, reflecting stron

BUY TODAY SELL TOMORROW for 5%DON’T HAVE TIME TO MANAGE YOUR TRADES?
- Take BTST trades at 3:25 pm every day
- Try to exit by taking 4-7% profit of each trade
- SL can also be maintained as closing below the low of the breakout candle
Now, why do I prefer BTST over swing trades? The primary reason is that I have observed that


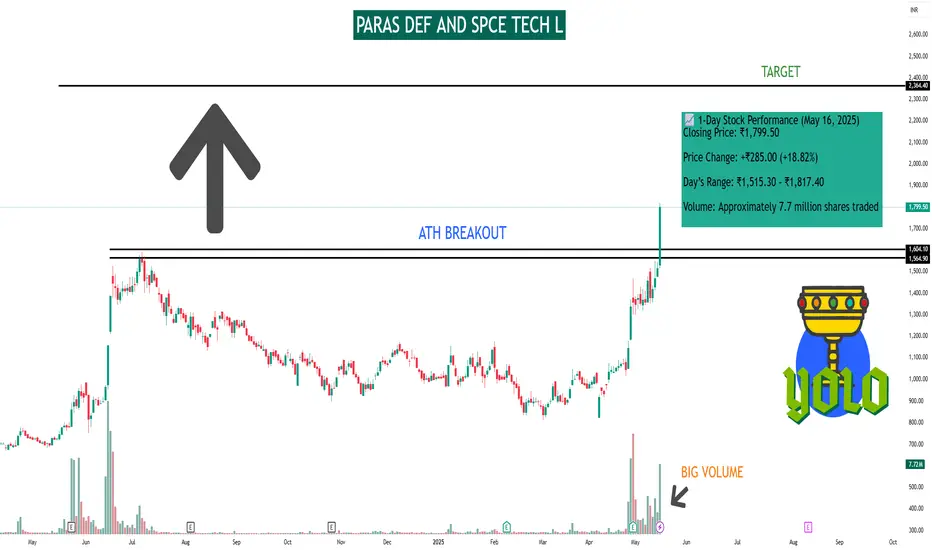
PARAS DEF AND SPCE TECH LAs of May 16, 2025, Paras Defence and Space Technologies Ltd (NSE: PARAS) experienced a significant surge in its stock price.
📈 1-Day Stock Performance (May 16, 2025)
Closing Price: ₹1,799.50
Price Change: +₹285.00 (+18.82%)
Day’s Range: ₹1,515.30 – ₹1,817.40
Volume: Approximately 7.7 million sh
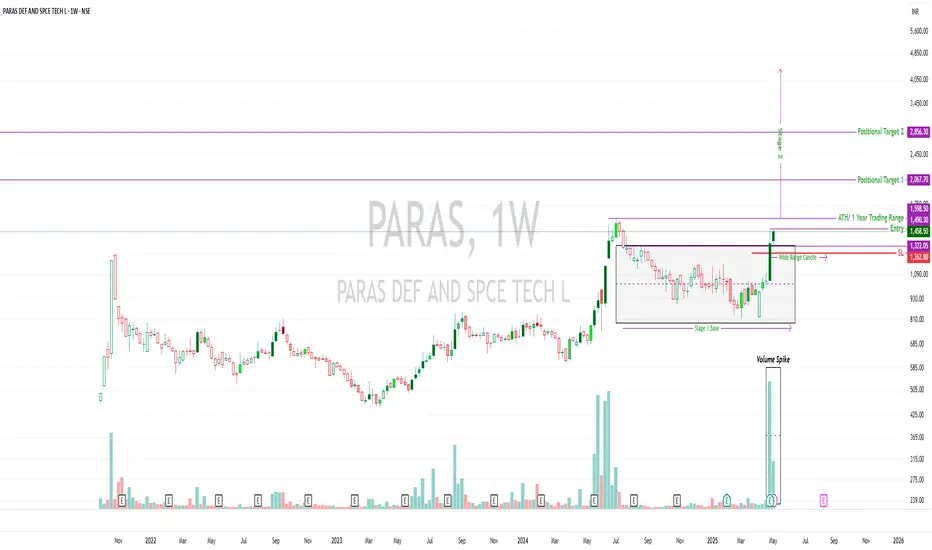
PARAS | Stage 2 Setup in Motion | ATH Watch🚀 PARAS | Stage 2 Setup in Motion | ATH Watch
Paras Defence & Space Tech Ltd | Weekly Chart
🔍 Technical Overview:
Stock has broken out of a Stage 1 base spanning nearly a year 📦
Printed a wide-range breakout candle with a massive volume spike – signs of institutional accumulation
Currently tra
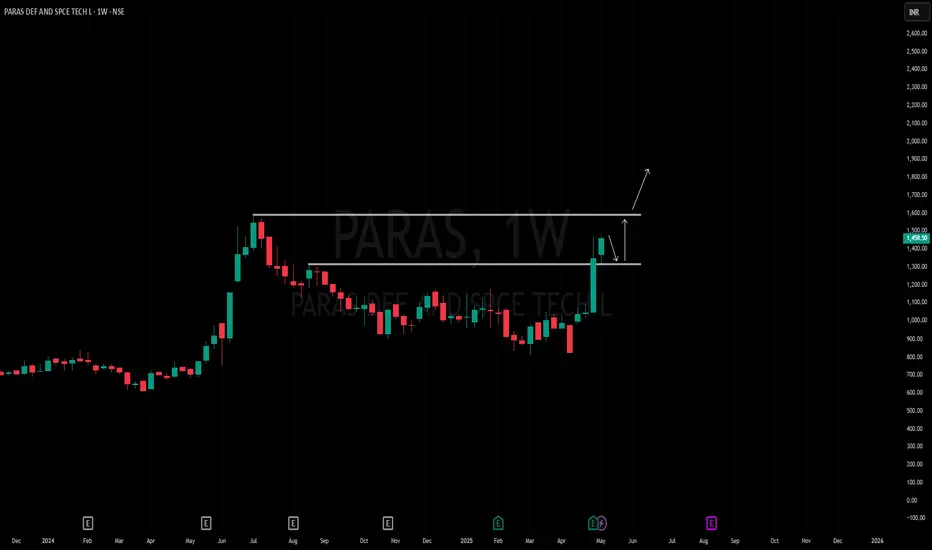
Amazing breakout on WEEKLY Timeframe - PARASCheckout an amazing breakout happened in the stock in Weekly timeframe, macroscopically seen in Daily timeframe. Having a great favor that the stock might be bullish expecting a staggering returns of minimum 25% TGT. IMPORTANT BREAKOUT LEVELS ARE ALWAYS RESPECTED!
NOTE for learners: Place the break
See all ideas
Summarizing what the indicators are suggesting.
Neutral
SellBuy
Strong sellStrong buy
Strong sellSellNeutralBuyStrong buy
Neutral
SellBuy
Strong sellStrong buy
Strong sellSellNeutralBuyStrong buy
Neutral
SellBuy
Strong sellStrong buy
Strong sellSellNeutralBuyStrong buy
An aggregate view of professional's ratings.
Neutral
SellBuy
Strong sellStrong buy
Strong sellSellNeutralBuyStrong buy
Neutral
SellBuy
Strong sellStrong buy
Strong sellSellNeutralBuyStrong buy
Neutral
SellBuy
Strong sellStrong buy
Strong sellSellNeutralBuyStrong buy
Displays a symbol's price movements over previous years to identify recurring trends.
MODEFENCE
Motilal Oswal Nifty India Defence ETF Units Exchange Traded FundWeight
0.84%
Market value
734.68 K
USD
GROWWDEFNC
Groww Nifty India Defence ETF Units Exchange Traded FundWeight
0.84%
Market value
216.64 K
USD
Explore more ETFs
Frequently Asked Questions
The current price of PARAS is 705.70 INR — it has increased by 0.26% in the past 24 hours. Watch Paras Defence & Space Technologies Ltd. stock price performance more closely on the chart.
Depending on the exchange, the stock ticker may vary. For instance, on BSE exchange Paras Defence & Space Technologies Ltd. stocks are traded under the ticker PARAS.
PARAS stock has fallen by −2.48% compared to the previous week, the month change is a −4.85% fall, over the last year Paras Defence & Space Technologies Ltd. has showed a 31.29% increase.
We've gathered analysts' opinions on Paras Defence & Space Technologies Ltd. future price: according to them, PARAS price has a max estimate of 976.00 INR and a min estimate of 976.00 INR. Watch PARAS chart and read a more detailed Paras Defence & Space Technologies Ltd. stock forecast: see what analysts think of Paras Defence & Space Technologies Ltd. and suggest that you do with its stocks.
PARAS reached its all-time high on May 19, 2025 with the price of 971.80 INR, and its all-time low was 223.55 INR and was reached on Mar 28, 2023. View more price dynamics on PARAS chart.
See other stocks reaching their highest and lowest prices.
See other stocks reaching their highest and lowest prices.
PARAS stock is 3.68% volatile and has beta coefficient of 2.55. Track Paras Defence & Space Technologies Ltd. stock price on the chart and check out the list of the most volatile stocks — is Paras Defence & Space Technologies Ltd. there?
Today Paras Defence & Space Technologies Ltd. has the market capitalization of 56.67 B, it has increased by 2.85% over the last week.
Yes, you can track Paras Defence & Space Technologies Ltd. financials in yearly and quarterly reports right on TradingView.
Paras Defence & Space Technologies Ltd. is going to release the next earnings report on Nov 6, 2025. Keep track of upcoming events with our Earnings Calendar.
PARAS earnings for the last quarter are 3.70 INR per share, whereas the estimation was 4.80 INR resulting in a −22.92% surprise. The estimated earnings for the next quarter are 5.30 INR per share. See more details about Paras Defence & Space Technologies Ltd. earnings.
Paras Defence & Space Technologies Ltd. revenue for the last quarter amounts to 932.00 M INR, despite the estimated figure of 1.09 B INR. In the next quarter, revenue is expected to reach 1.18 B INR.
PARAS net income for the last quarter is 148.70 M INR, while the quarter before that showed 197.20 M INR of net income which accounts for −24.59% change. Track more Paras Defence & Space Technologies Ltd. financial stats to get the full picture.
Yes, PARAS dividends are paid annually. The last dividend per share was 0.50 INR. As of today, Dividend Yield (TTM)% is 0.07%. Tracking Paras Defence & Space Technologies Ltd. dividends might help you take more informed decisions.
Paras Defence & Space Technologies Ltd. dividend yield was 0.10% in 2024, and payout ratio reached 6.24%. The year before the numbers were 0.00% and 0.00% correspondingly. See high-dividend stocks and find more opportunities for your portfolio.
As of Oct 17, 2025, the company has 537 employees. See our rating of the largest employees — is Paras Defence & Space Technologies Ltd. on this list?
EBITDA measures a company's operating performance, its growth signifies an improvement in the efficiency of a company. Paras Defence & Space Technologies Ltd. EBITDA is 950.40 M INR, and current EBITDA margin is 27.87%. See more stats in Paras Defence & Space Technologies Ltd. financial statements.
Like other stocks, PARAS shares are traded on stock exchanges, e.g. Nasdaq, Nyse, Euronext, and the easiest way to buy them is through an online stock broker. To do this, you need to open an account and follow a broker's procedures, then start trading. You can trade Paras Defence & Space Technologies Ltd. stock right from TradingView charts — choose your broker and connect to your account.
Investing in stocks requires a comprehensive research: you should carefully study all the available data, e.g. company's financials, related news, and its technical analysis. So Paras Defence & Space Technologies Ltd. technincal analysis shows the neutral today, and its 1 week rating is neutral. Since market conditions are prone to changes, it's worth looking a bit further into the future — according to the 1 month rating Paras Defence & Space Technologies Ltd. stock shows the strong buy signal. See more of Paras Defence & Space Technologies Ltd. technicals for a more comprehensive analysis.
If you're still not sure, try looking for inspiration in our curated watchlists.
If you're still not sure, try looking for inspiration in our curated watchlists.