Long One 97 (Paytm ) above 720Volatility contraction with ascending triangle is observed in paytm
Buy above 720 , Target 750++
** For educational purpose only**
PAYTM trade ideas

Swing or positional setup in PAYTMPaytm forming a inverse head shoulder pattern on daily timeframe ..
a good breakout can happen target are according to Given levels

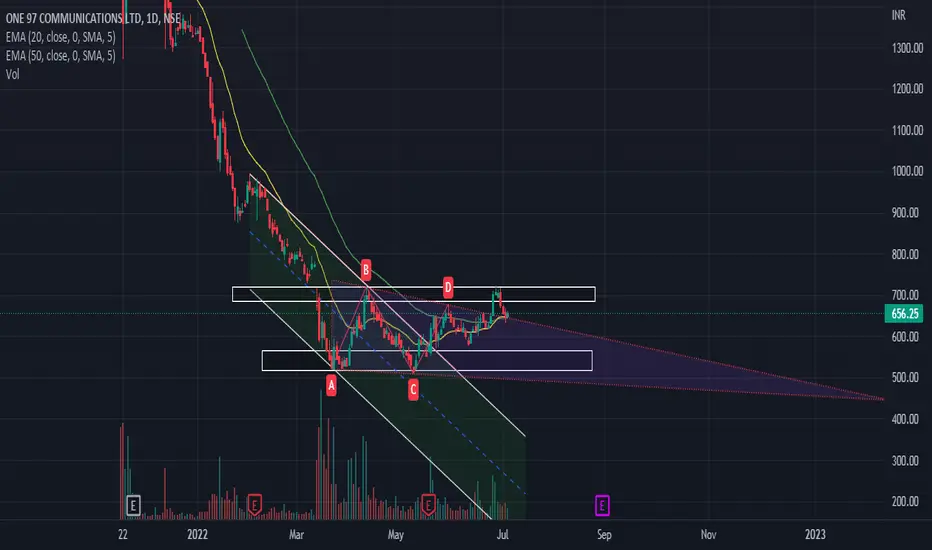
PAYTM karoan ascending tringle with 210 depth is forming at lower levels on daily charts with decent volumes, a sustainable breakout above 720 will confirm the pattern breakout with targets of 900-930. Any close below rising trendline will invalidate the pattern.


PAYTM has retested and showing bullish signshey guys ,
after a long DOWNTREND ,
PAYTM stock has shown a signs of recovery ,
from the very FIRST DAY , this stock was completely controlled by bears
but now , this stock was following a chart pattern called FALLING WEDGE
last week , this stock was trying to cross this pattern
ans it was SUCCESSFULLY COMPLETED .
And now this stock has retested
and it has shown a great green candle ,
which convince us to bet on this stock
and earn HIGH RETURNS
BUT FIRST CONSIDER THE GLOBAL SITUATIONS
.INFLATION
. WAR BETWEEN UKRAINE AND RUSSIA
. RISING BANK RATES
. AND INCREASING EXPORT DUTIES
AFTER CONSIDERING THESE SITUATIONS
YOU CAN BUY THIS STOCK
BUT PLS GUYS , SEE THAT IF MARKET IS OPENING GAP DOWN
THAT THIS STOCK IS UNDER HIS RESISTANCE AREA
THEN PLS WAIT AND LET THIS STOCK TRY TO CROSS HIS RESISTANCE AREA
and guys , if u like my analysis
. follow
. like
. and comment
PayTM ShortEntry price: 685.15
SL - 659.55
Target - 750.8
Note: View shared for educational purpose only. Conduct your due diligence before making any trading/investment decisions.

PAYTM -- UPPER CHANNEL BREAKOUTPAYTM --DAILY CHART -- UPPER CHANNEL BREAKOUT
1. PAYTM Daily chart seen upper channel breakout above 680 today trading session which was strong resistance earlier broken upside seen chart bullish now
2. RSI seen move above 60 daily chart
3. as per new chart setup 660-680 woRk as strong support with target 720-750-780-800 and stop loss can place bellow 625 level
4. MACD seen bullish , stock trading above 20,50,200 Moving avg.
** THIS IDEA IS FOR EDUCATIONAL PURPOSE .. trade at own risk
HAPPY TRADING . !!

Bullish Triangle Breakout in PaytmHi. Friends....
Paytm looks very bullish.Recently this stock has given Triangle breakout.Keep this stock in Watchlist.

PAYTM: Will it turn the tables for Investors now?#PAYTM #Chart
Classic VCP Break Out here. Ride to 770-775 highly possible here. However, that's also the area of concern. Major upside only above this level. Need to hold on to 650 on Daily Closing Basis for this to happen.

PAYTM - showing good reversal signs#PAYTM, may give a breakout above this 730. better to add after a breakout and re-test to 730, can be a potential stage 2 candidate.

Resistance breakout watchoutPreviously it's make triangle pattern. Resistance in area as mentioned in the graph buy above 727.5
For target Do your analysis 😁.

Paytm.. hero or zero Symmetrical triangle breakout
Bullish rsi
Wait for a little consolidation
Buying zone 650-680
Stoploss 570

Trading Near Resistance ZonePaytm is trading near its resistance zone.
There are two possibilities:
1). If it sustains above this zone then good bullish move can be seen,
2). If fails to cross this zone then bearish move can be expected.
Disclaimer: This is for educational purpose only.


PayTM BuyPaytm looks promising
There loan distribution is going up.
If all goes well Paytm Bank will renew onboarding...
Risky Buy
Best part promoter is buying it's own share.
Buy this for tgt of 1200++
Happy Trading


Paytm Ichimoku Bullish Breakout Stock Name - Paytm
Ichimoku Cloud Setup :
1). Today's close is above the Conversion Line
2). Future Kumo is not Bullish
3). Chikou span is slanting upwards
Keep in Watch list for upcoming days.
More strength will be visible only above 662
#This is not Buy and Sell recommendation to any one. This is for education purpose and a helping hand to learn trading in Market.
# Rule Based Investing
# Ichimoku Cloud
# Ichimoku Followers
I hope you all like my analysis.
Please do share your thoughts into comment section.
Please give a like, it motivates me to do analysis.

PaytmPaytm showing strength in weak market, nice sign of accumulation, contacting volumes on up days volume increasing, and down days increasing.
Buy above 700 for the target of 1200

[Basket] Paytm Buy IdeaPlease do not buy unless triggers.
Last trade costed 20 points.
Note -
One of the best forms of Price Action is to not try to predict at all. Instead of that, ACT on the price. So, this chart tells at "where" to act in "what direction. Unless it triggers, like, let's say the candle doesn't break the level which says "Buy if it breaks", You should not buy at all.
=======
I use shorthands for my trades.
"Positional" - means You can carry these positions and I do not see sharp volatility ahead. (I tally upcoming events and many small kinds of stuff to my own tiny capacity.)
"Intraday" -means You must close this position at any cost by the end of the day.
"Theta" , "Bounce" , "3BB" or "Entropy" - My own systems.
=======
I won't personally follow any rules. If I "think" (It is never gut feel. It is always some reason.) the trade is wrong, I may take reverse trade. I may carry forward an intraday position. What is meant here - You shouldn't follow me because I may miss updating. You should follow the system I share.
=======
Like -
Always follow a stop loss.
In the case of Intraday trades, it is mostly the "Day's High".
In the case of Positional trades, it is mostly the previous swings.
I do not use Stop Loss most of the time. But I manage my risk with options as I do most of the trades using derivatives.
=======

PAYTM -- INTRADAY SETUP- 06/06/2022PAYTM -- HOURLY CHART -- INTRADAY SETUP -- 06/06/2022
1. PAYTM trading currently at upper channel on hourly chart
2. trendline seen consecutive support at lower level, stock currently close at trendline support closing candle where bounce back likely seen on next trading session .
3. for buy level stock should cross level 625 as trendline breakout on next trading session where target upper side can seen above 635-640 level,
4. if trendline breakdown bellow 615 level stock will seen downside target bellow 600 level on intraday
5. overall stock will be uptrend if 15 min closing candle above 625 or downtrend if 15 min candle bellow 615
6. positive in fvr of uptrend is histogram seen double bottom means supply can be decrese from current level and more fvr of uptrend from current level
7. RSI abobe 50 level at daily basis as neutral to positive
** THIS IDEA IS FOR EDUCATIONAL PURPOSE .. trade at owb risk !
HAPPY TRADING. !!

Secrets of Successful TradingI was banned because of an accidental mistake I made in my previous post which should explain my absence. After thinking a lot about my trading so far, I realized that accuracy is not something I am after but rather big home runs like these. Most traders anyway are between 40-60% so it seems like there seems to be an imaginary cap on the accuracy anyway so I decided to increase the RR of my trading system and it is paying tremendous dividends. The upside is that this system works fantastically during bear/rangebound market periods as you are buying the lows. The downside of this system is that accuracy can be on the lower end (20-25%) but you can still come out profitable. As a trader starting out, it can also help you develop patience because the winners are worth the wait. In order to stay in the game trading this system, a risk of 0.25% per trade keeps you calm during bad trades. A single winner can wipe out as many as 9 LOSERS. Questions are welcome in the comments and follow me to learn highly asymmetrical RR trading! Cheers.

book value increasing month by monthBook value increasing month by month
PROS
Company has reduced debt.
Company is almost debt free.

