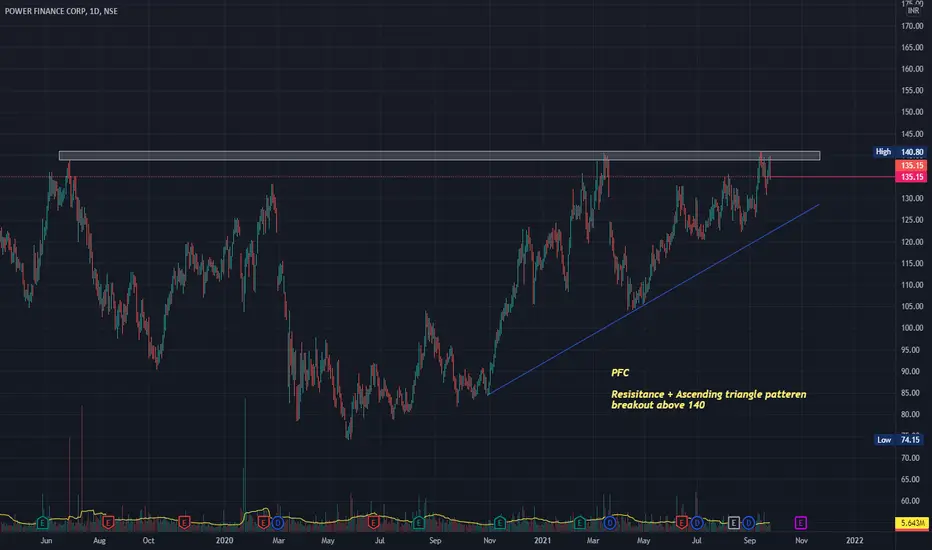
PFC fundamentally strong stockNSE:PFC
breaks its 2 yrs résistance.
also ready to coming out from 10 yrs channel pattern.
buy on dips SL- below the zone.
#LONGTERM STOCK
#the_pravin #simPlepriceaction #notoindicator #nakedchart #swingtrading
PFC trade ideas

Double BOTTOM - SIMPLE AND POWERFULDear friends,
Explained everything in the chart.
Happy investing.
Regards,
Indian Ox

PFC 121.8It is in continuation to earlier idea. It has taken support at 50 EMA and Fib retracement level 23.6.

PFC Head and Shoulder pattern formation and retest of prev highClear Inverse HNS pattern formation in PFC which is a positive signal to go long in the stock
CMP is 139
SL is 119 (Daily closing basis)
Target1 is Rs 156
Target2 is Rs 169
Target3 is Rs 200
Do your own analysis before investing.

We can expect 44% return in PFC stockIn PFC stock triangle pattern formed and also inverted head and shoulder also broken . so i expect buy trend in coming months

PFC looks bullish with huge multi year multiple pattern breakoutPFC is at the verge of multiple pattern breakout in monthly timeframe
1. 4Y double bottom pattern
2. 2Y inverted head & shoulder pattern
3. 10Y trendline breakout

PFC - INTRADAY BREAK & RETEST Plan your Trade & Trade your Plan
Up trending Stock
Inverse Head & Shoulders Pattern Breakout
Retest to H&S Neckline
Fib Rejection from 50% level
Entry can be done with confluence from lower timeframe like 5min or lower if you like.
Let uptrend be confirmed in lower timeframe and place your stoploss by looking at higher time frame.

Double BOTTOM - SIMPLE AND POWERFULDear friends,
I explained everything in the chart.
Thanks,
Indian OX

inverse head and shoulder patternit gives breakout of inverse head and shoulder pattern
It also gives channel pattern breakout in weekly time frame
Volume also looks good

trade with cup & handle !!!pfc : 128.70
trade set up :
1. buy above 131
2. keep stoploss as 119 on closing basis
3. targets : 142 / 156+
buying based on technical:
1. cup & handle
2. multiple resistance breakout
3. volume accumulation


SELF EXPLANATORY SERIES : QUICK ANALYSIS ON PFCIn this self explanatory series i will be posting charts with pure technical analysis only without full length explanations , Traders can ask their doubts in comments section, Happy trading.
Disclaimer : This idea was to just give you an insight about my own view and personal observations. Please do your own research or consult an investment advisor before doing any investment or trading

PFC, Inverted Head & Shoulder breakoutDetailed explanation on chart.
Thanks
Piyush Gupta
Learn & Earn

Super 3T VCP BOLong consolidation .
Good EPS Growth
Consistent Margins
Disc: For Educational purpose

PFC Volatility Contraction BreakoutPFC has given a breakout after consolidation. Volatility had contracted and today PFC has given a breakout above the sloping trendline


PFC NEAR BREAKOUTStock is trading near strong supply zone and this time it looks like stock will breakout wait for weekly close above the supply and buy for given targets.. Purely for education purpose research on your own before investing

PFC LongPFC Expecting some consolidation and pullback before rally try buying along with the institution best entry 128-130 zones

PFC - btstBuy from 130.4 to 129.5
easy target - 133
tg2 - 135
Disclaimer : This is my personal analysis for study purpose not intended for trading

Intraday and Swing Trade: watch for resistance breakoutbuy above 141 in Intraday and Swing
For stoploss in Intraday use 5 minute chart and see nearest support.
for target use 5 min chart and fibonacci pivots as i don't keep predefined target.
try to book partially and trail.
Note: this is not a prediction for LONG/SHORT, trade will trigger only on given level as per technical analysis
NOTE: For Gapup or bo before 9:20
If gapup is more than 1% from bo level than avoid completely.
if less than 1% or gives bo before 9:20 than wait for
first 5 minute candle and entry above 5 minute candle
and revised SL below candle Low.

Channel + ATH Breakout in PFCPFC looking good for channel and ATH breakout
Buy above 141 (15-min candle close) for 150/162/198.
Please use trail SL after T2.
SL 138 CLBS.

is it right time to enter pfc?can PFC give us good return in near term?
forming head and shoulder, cup and handle at the same time.
personally i will be entering at 140 and will add more after price closes above 150 in daily chart.
Above 150 will be breakout in symmetrical triangle in weekly chart, and will hold for next 1-2 years.
