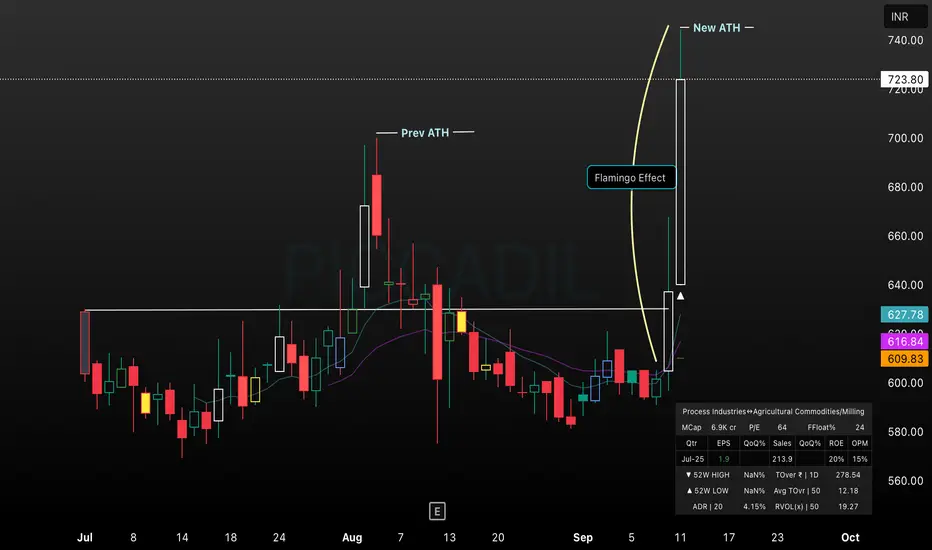
PICCADIL ATH Breakout | Flamingo Effect in PlayPICCADIL has surged past its previous all-time high (ATH), confirming a strong bullish momentum after multi-month consolidation. The “Flamingo Effect” highlights how breakout rallies can accelerate when all holders turn profitable and shorts scramble to cover. This setup is favored by swing traders—
11.55 INR
1.02 B INR
7.97 B INR
22.91 M
About Piccadily Agro Industries Limited
Sector
Industry
CEO
Harvinder Singh Chopra
Website
Headquarters
Gurugram
Founded
1994
ISIN
INE546C01010
FIGI
BBG000F8GR80
Piccadily Agro Industries Ltd. engages in the production of sugar and their by-products. It operates through Sugar and Distillery segments. The Sugar segment comprises sugar, molasses, and bagasse. The Distillery segment offers liquor, malt, carbon dioxide gas, and ethanol. The company was founded in 1994 and is headquartered in Haryana, India.
Related stocks
Piccadily Agro Industries LtdDate 30.08.2025
Piccadily Agro Industries
Timeframe : 2 Hrs Chart
Business Segments
(1) Distillery 75%
(2) Sugar 25%
Brand Leadership
(1) Indri is the top-selling Indian Single Malt Brand in India & globally
(2) With a 30%+ market share in single malt whisky in India f
Operational Metrics
(1)
Piccadily AgroConstantly voted the Top Indian Whiskey the demand for this company is not the problem.
Its supply that they are working to increase as as more of their whiskey is read to supply..the numbers will keep improving.
With recent M&A activity in the whiskey market this stock is primed to go up.
Long ab

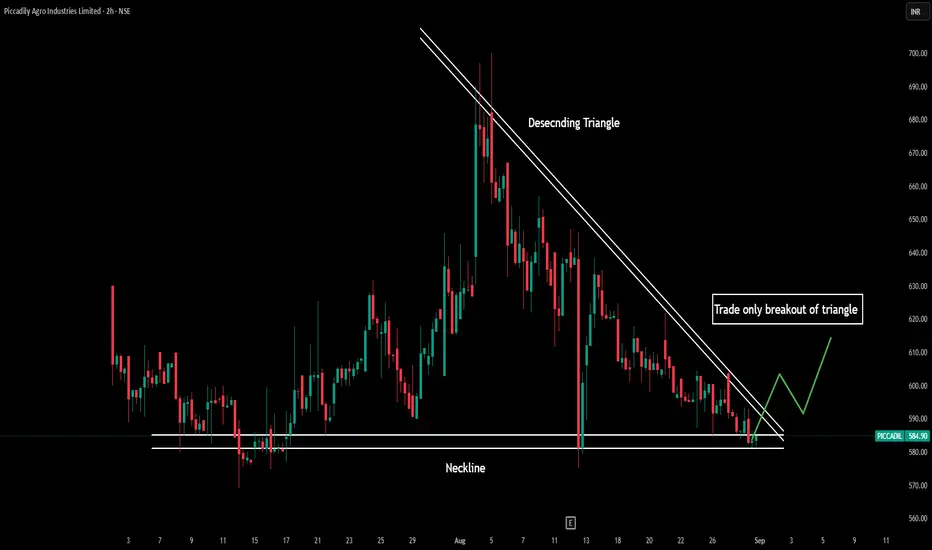
PICCADIL - CnH -Consolidation BreakOut-DailyThis chart **Piccadily Agro Industries Ltd.** (PICCADIL) on the **BSE**.
Here are the key technical observations:
1. **Pattern:**
- An **cup-and-handle pattern** is identified, which is typically a bullish continuation setup.
- The price has confirmed a breakout above the handle's resistance
Easy 20% return with Piccadily Agro IndustriesBSE:PICCADIL looks perfectly poised to give a solid 20% return to investors with a short term horizon.
Technicals: When we see the candlestick chart on a daily basis, it is trading at 750 which lies in between its nearest support at 700 and nearest resistance of 780. The MACD indicator points in

Piccadily agro giving signs of reversal on RSIPiccadily showing signs of reversal on RSI, must touch 4 digit mark soon.

Piccadilly Agro Industries Ltd - LongPiccadilly Agro Industries Ltd - Long
Buy Zone: ₹340 - ₹364
Stoploss: ₹325.55
Target: ₹401.15
Trade and Invest Wisely with your knowledge! Good Luck!
You can also see my other stock analysis and the results in my profile ideas. Please follow me, If you would like to see more ideas on winning st

buy @ 40 multibaggerbuy @ 40 multibagger stock
it will going to turn out will see at 100 in dec 2022

Long Term Wealth Creation Idea 2020 #5#PICCADIL 9.60 | Accumulate with long term perspective upto 7.6 levels for at least 2x/5x+ gains... Valuation | Dividend | P/E | P/B | EV/EBITDA | MCAP/SALES : Lucrative Favorable Portfolio allocation : Upto 5% of Overall Capital
*DII enters in Sep2020 Shareholding pattern

See all ideas
Summarizing what the indicators are suggesting.
Oscillators
Neutral
SellBuy
Strong sellStrong buy
Strong sellSellNeutralBuyStrong buy
Oscillators
Neutral
SellBuy
Strong sellStrong buy
Strong sellSellNeutralBuyStrong buy
Summary
Neutral
SellBuy
Strong sellStrong buy
Strong sellSellNeutralBuyStrong buy
Summary
Neutral
SellBuy
Strong sellStrong buy
Strong sellSellNeutralBuyStrong buy
Summary
Neutral
SellBuy
Strong sellStrong buy
Strong sellSellNeutralBuyStrong buy
Moving Averages
Neutral
SellBuy
Strong sellStrong buy
Strong sellSellNeutralBuyStrong buy
Moving Averages
Neutral
SellBuy
Strong sellStrong buy
Strong sellSellNeutralBuyStrong buy
Displays a symbol's price movements over previous years to identify recurring trends.
Frequently Asked Questions
The current price of PICCADIL is 608.35 INR — it has decreased by −0.88% in the past 24 hours. Watch Piccadily Agro Industries Limited stock price performance more closely on the chart.
Depending on the exchange, the stock ticker may vary. For instance, on BSE exchange Piccadily Agro Industries Limited stocks are traded under the ticker PICCADIL.
PICCADIL stock has fallen by −3.58% compared to the previous week, the month change is a −6.69% fall, over the last year Piccadily Agro Industries Limited has showed a −20.19% decrease.
PICCADIL reached its all-time high on Dec 26, 2024 with the price of 1,019.90 INR, and its all-time low was 0.30 INR and was reached on Apr 1, 2004. View more price dynamics on PICCADIL chart.
See other stocks reaching their highest and lowest prices.
See other stocks reaching their highest and lowest prices.
PICCADIL stock is 1.88% volatile and has beta coefficient of 1.49. Track Piccadily Agro Industries Limited stock price on the chart and check out the list of the most volatile stocks — is Piccadily Agro Industries Limited there?
Today Piccadily Agro Industries Limited has the market capitalization of 57.89 B, it has decreased by −1.29% over the last week.
Yes, you can track Piccadily Agro Industries Limited financials in yearly and quarterly reports right on TradingView.
PICCADIL net income for the last quarter is 267.22 M INR, while the quarter before that showed 184.29 M INR of net income which accounts for 44.99% change. Track more Piccadily Agro Industries Limited financial stats to get the full picture.
Piccadily Agro Industries Limited dividend yield was 0.00% in 2024, and payout ratio reached 0.00%. The year before the numbers were 0.00% and 0.00% correspondingly. See high-dividend stocks and find more opportunities for your portfolio.
As of Dec 1, 2025, the company has 1.04 K employees. See our rating of the largest employees — is Piccadily Agro Industries Limited on this list?
EBITDA measures a company's operating performance, its growth signifies an improvement in the efficiency of a company. Piccadily Agro Industries Limited EBITDA is 1.97 B INR, and current EBITDA margin is 23.13%. See more stats in Piccadily Agro Industries Limited financial statements.
Like other stocks, PICCADIL shares are traded on stock exchanges, e.g. Nasdaq, Nyse, Euronext, and the easiest way to buy them is through an online stock broker. To do this, you need to open an account and follow a broker's procedures, then start trading. You can trade Piccadily Agro Industries Limited stock right from TradingView charts — choose your broker and connect to your account.
Investing in stocks requires a comprehensive research: you should carefully study all the available data, e.g. company's financials, related news, and its technical analysis. So Piccadily Agro Industries Limited technincal analysis shows the sell today, and its 1 week rating is sell. Since market conditions are prone to changes, it's worth looking a bit further into the future — according to the 1 month rating Piccadily Agro Industries Limited stock shows the buy signal. See more of Piccadily Agro Industries Limited technicals for a more comprehensive analysis.
If you're still not sure, try looking for inspiration in our curated watchlists.
If you're still not sure, try looking for inspiration in our curated watchlists.