PI Industries 1 Day ViewIntraday Snapshot
Latest Price:
As per Investing.com, the price on August 25, 2025, stood at ₹3,903.80, marking a 1.00% gain for the day
Moneycontrol shows a pre-opening/early trading figure of ₹3,907.70, up roughly 1.10%
Daily Price Range:
Highest: ₹3,915.80
Lowest: ₹3,844.10
Previous Close: ₹3,865.10 on August 22, 2025, meaning today’s gain is from this base
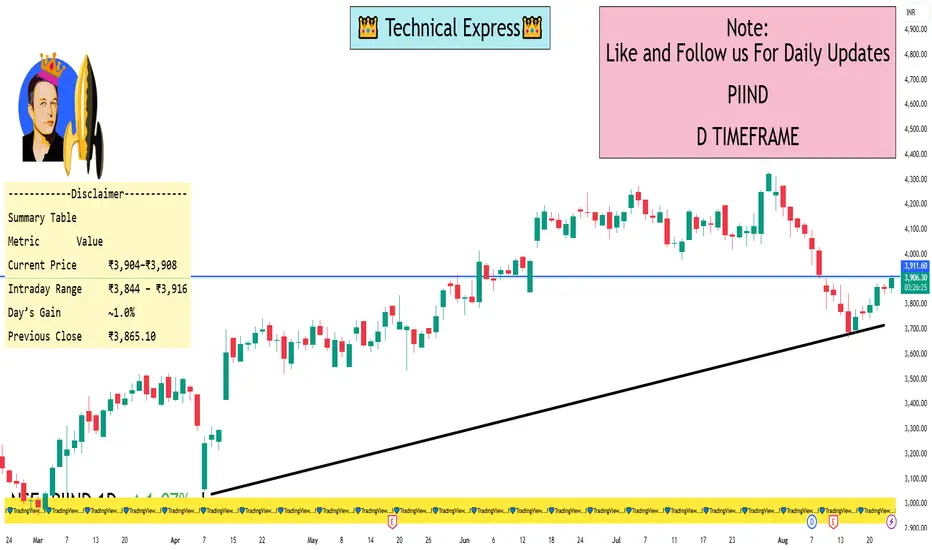
Summary Table
Metric Value
Current Price ₹3,904–₹3,908
Intraday Range ₹3,844 – ₹3,916
Day’s Gain ~1.0%
Previous Close ₹3,865.10
PIIND trade ideas
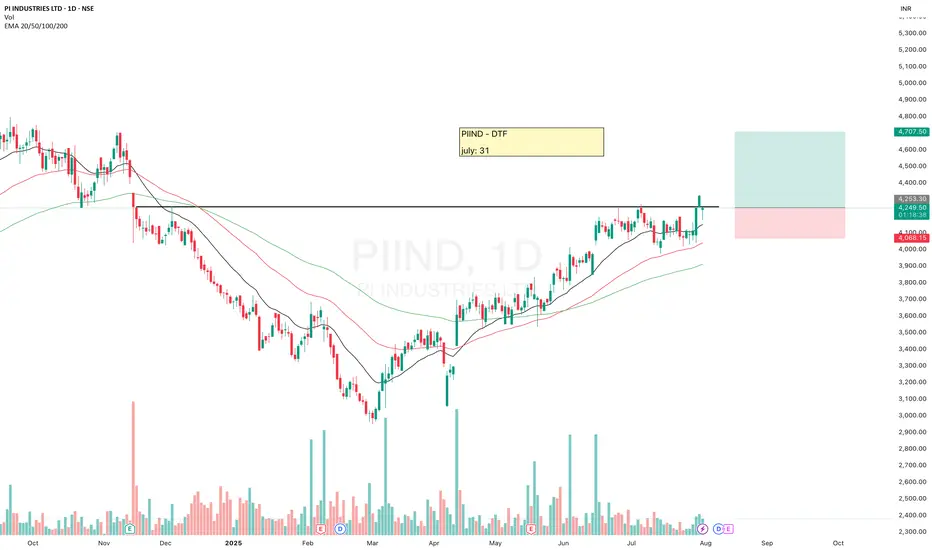
PIINDPIIND is looking good.
It has made HH-HL formation, moving above 20ema and breakout from here may give a good upside move. Keep eyes on it.
✅ If you like my analysis, please follow me here as a token of appreciation :)
in.tradingview.com/u/SatpalS/
📌 For learning and educational purposes only, not a recommendation. Please consult your financial advisor before investing.
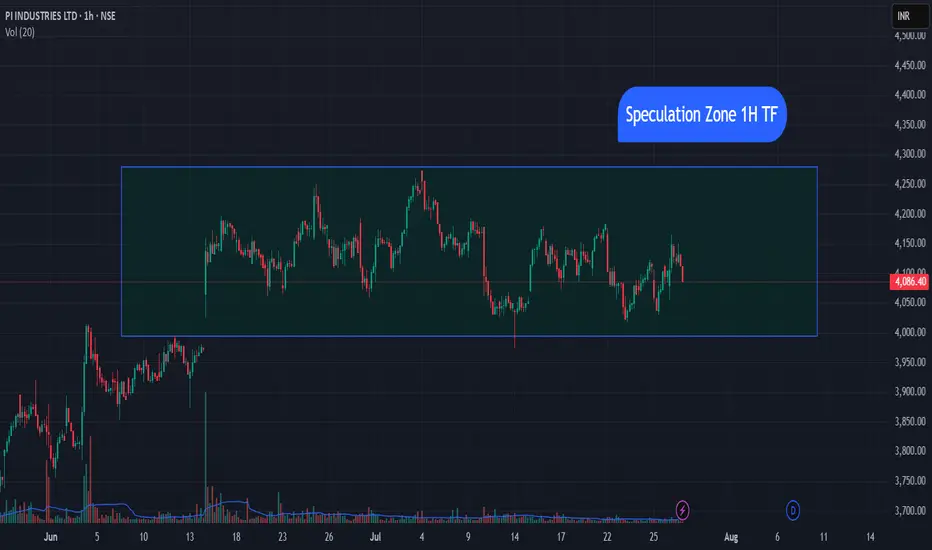
PIIND chart If you Watching PI ind chart its showing Speculation Zone so W8 Confirmation next Movement 4200 Resistance and 4000 Support NOt for Trading only For Study
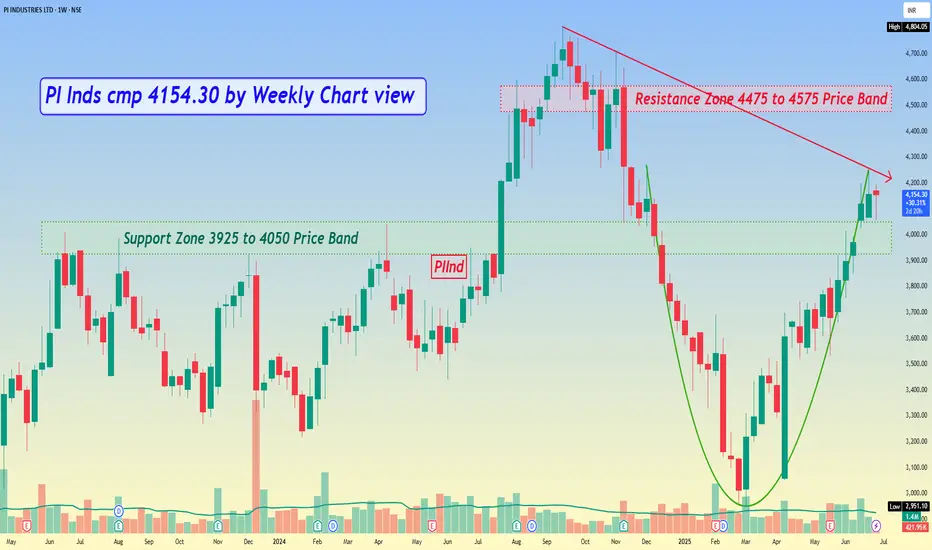
PI Inds cmp 4154.30 by Weekly Chart view*PI Inds cmp 4154.30 by Weekly Chart view*
- Support Zone 3925 to 4050 Price Band
- Resistance Zone 4475 to 4575 Price Band
- Bullish Rounding Bottom done above Support Zone
- Falling Resistance Trendline Breakout awaited to happen
- Support Zone been tested and retested for upside reversal
- Technical Indicators EMA, MACD, RSI, BB seem turning positive
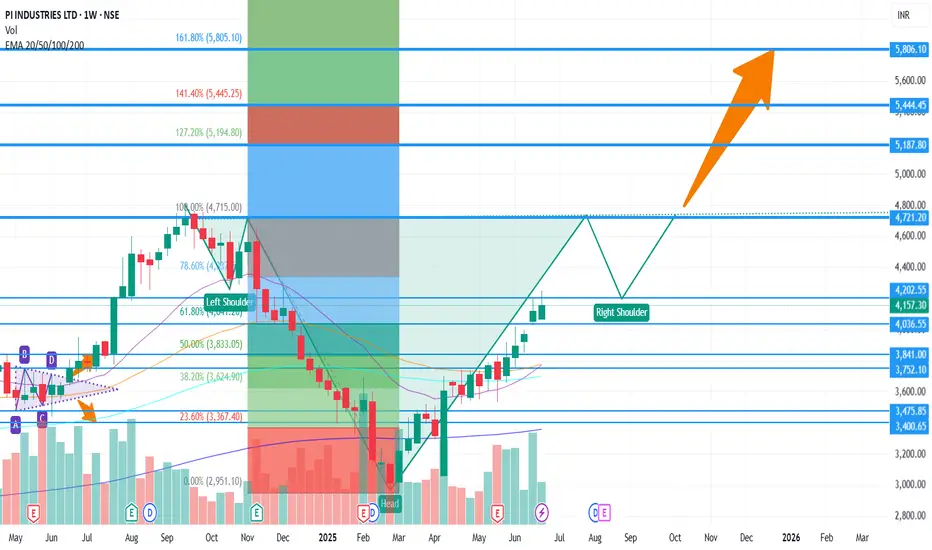
Long PIIND - Target 5800PIIND on weekly chart is forming Inverted Head and Shoulders Pattern.
The stop loss is low of the Head.
Target 1 - 4800
Target 2 - 5300
Target 3 - 5800
PI Industries Ltd. PI Industries Ltd. operates a diversified business model centered on agrochemicals, specialty chemicals, and custom synthesis and manufacturing (CSM), with a focus on innovation, research, and global partnerships.
1. Core Business Segments
Agrochemicals (Domestic and Export):
Domestic Market: PI Industries develops, manufactures, and distributes crop protection products (insecticides, fungicides, herbicides) and plant nutrients tailored for Indian farmers. It leverages a strong distribution network to cater to agricultural needs, focusing on high-efficacy, innovative products.
Export Market: A significant portion of revenue comes from exporting agrochemicals, particularly to global markets, where it supplies active ingredients and formulated products to multinational corporations.
Custom Synthesis and Manufacturing (CSM):
PI Industries partners with global agrochemical and chemical companies to provide custom synthesis and contract manufacturing services. This involves developing and producing complex molecules, intermediates, and active ingredients for clients, often under long-term contracts.
The CSM segment is a high-margin, high-growth area, driven by PI’s expertise in process chemistry and innovation, catering to global innovators in agrochemicals and fine chemicals.
Specialty Chemicals:
The company manufactures specialty chemicals for non-agricultural applications, diversifying its portfolio beyond traditional agrochemicals to include products for industrial and pharmaceutical uses.
2. Revenue Model
Product Sales: Revenue from selling branded agrochemicals and plant nutrients in the domestic market, with a focus on proprietary and patented products.
Contract-Based Revenue: Long-term contracts in the CSM segment generate stable income through the supply of customized molecules to global clients. This includes milestone payments for R&D and royalties from patented products.
Exports: A significant revenue driver, with ~60–70% of sales from international markets (as per historical data). Exports focus on high-value molecules and formulations for global agrochemical leaders.
Licensing and Royalties: Revenue from licensing proprietary molecules and technologies developed through in-house R&D.
3. Operational Strengths
Research and Development (R&D):
PI Industries invests heavily in R&D to develop innovative agrochemicals and efficient manufacturing processes. Its R&D centers focus on creating novel molecules and improving existing ones, supporting both domestic and CSM businesses.
The company holds patents for several molecules, enhancing its competitive edge and royalty income.
Manufacturing Capabilities:
Operates advanced manufacturing facilities in India (e.g., Jambusar and Panoli, Gujarat) with a focus on quality, safety, and scalability.
Facilities are designed to meet global regulatory standards, enabling exports to highlysumsung markets like the US, Europe, and Japan.
Global Partnerships:
Collaborates with leading global agrochemical companies for CSM, ensuring long-term contracts and access to cutting-edge technologies.
Distribution Network:
A robust domestic network ensures wide reach in India’s agricultural market, supported by strong branding and farmer engagement.
4. Key Features of the Business Model
Asset-Light Approach: PI Industries focuses on high-margin, R&D-driven products rather than commoditized chemicals, optimizing capital efficiency.
Sustainability Focus: Develops eco-friendly and efficient crop protection solutions, aligning with global sustainability trends.
Diversified Revenue Streams: Balances domestic sales, exports, and CSM to mitigate risks from market or regulatory fluctuations.
Scalable CSM Business: The CSM segment allows PI to leverage global demand for specialized chemicals, providing resilience against domestic market volatility.
5. Financial Impact
High Margins: The CSM segment and proprietary products yield strong operating margins (historically ~20–25%).
Revenue Growth: Achieved a 19% CAGR in revenue and 33% CAGR in profits over the last decade, driven by exports and CSM (as per X posts and financial data).
Stable Cash Flows: Long-term contracts and a low debt-to-equity ratio (~0.1) ensure financial stability and reinvestment capacity.
6. Recent Performance and Outlook
Q4 FY25 Results: Revenue grew 2.6% YoY to ₹1,787.1 crore, but PAT fell 10.6% to ₹330.5 crore, reflecting challenges in scaling new molecules and global demand slowdowns.
Guidance: Expects mid-single-digit growth in FY26, with a focus on expanding CSM and new product launches.
Market Sentiment: Despite short-term challenges, the company’s P/E ratio (29.6) is below historical averages, suggesting potential undervaluation for long-term investors.
7. Competitive Edge
Innovation-Driven: Strong R&D and patent portfolio differentiate PI from competitors in the agrochemical sector.
Global Reach: Strategic partnerships with global giants enhance market access and revenue stability.
Brand Strength: Well-established in India’s agricultural market with trusted brands and a focus on farmer education.
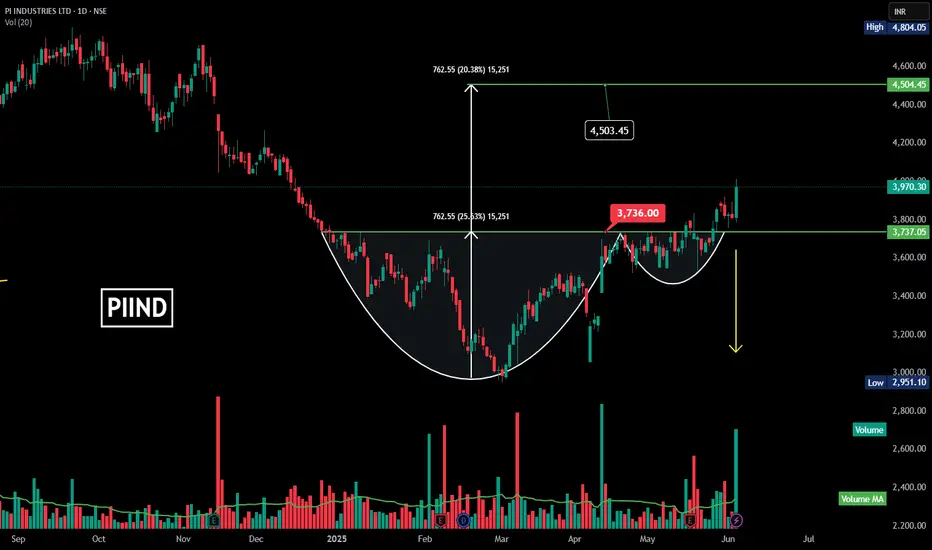
PIIND | Cup and Handle | Breakout | Good volume
**Stock:** PI INDUSTRIES LTD (PIIND)
**Chart Type:** Daily chart
**Pattern:** Cup and Handle formation
✅ **Key Technical Highlights:**
* A cup and handle pattern has formed, signaling a potential bullish breakout.
* Breakout level (resistance) is around ₹3,736, which has been successfully breached.
* Price has reached ₹3,970.30, indicating strength in the breakout.
✅ **Measured Target:**
* The measured move suggests a price target of approximately ₹4,504, reflecting a potential \~20% upside from the breakout level.
✅ **Volume Confirmation:**
* There’s a significant rise in volume during the breakout, confirming the strength and reliability of the move.
✅ **Key Support Level:**
* The breakout level at ₹3,736 now acts as immediate support.
✅ **Overall View:**
* With the breakout confirmed above ₹3,736, a strong uptrend is expected towards ₹4,504. Proper stop-loss below ₹3,736 can be used to manage downside risk.
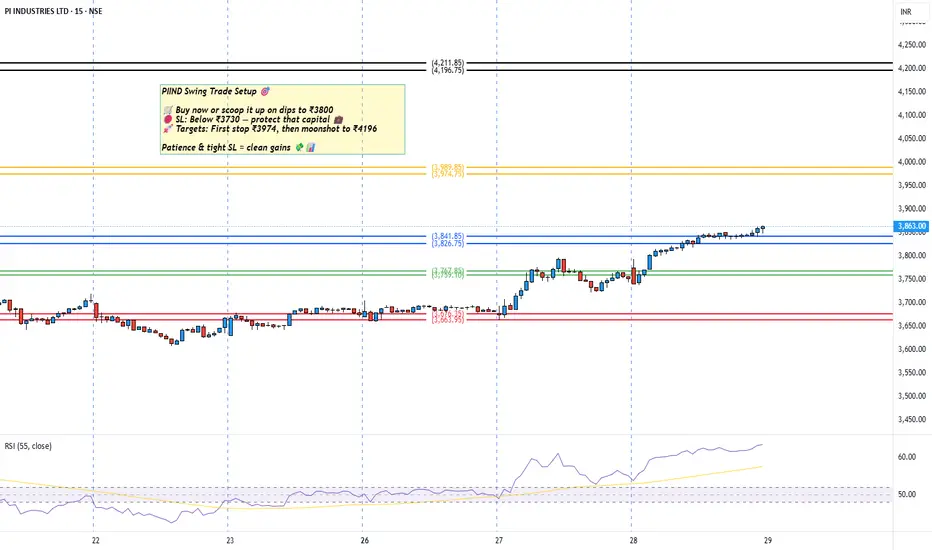
PIIND Swing Trade SetupPIIND Swing Trade Setup 🎯
🛒 Buy now or scoop it up on dips to ₹3800
🛑 SL: Below ₹3730 — protect that capital 💼
🚀 Targets: First stop ₹3974, then moonshot to ₹4196
Patience & tight SL = clean gains 💸📊
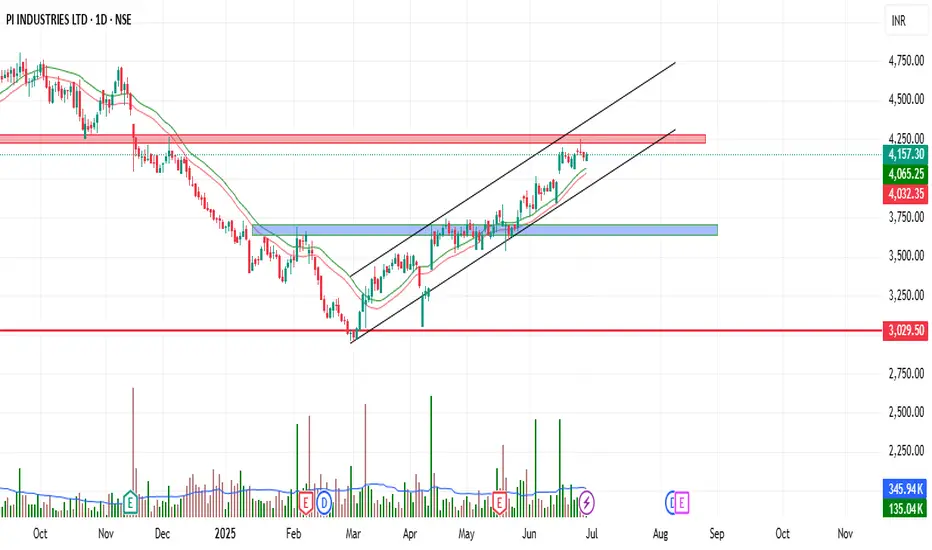
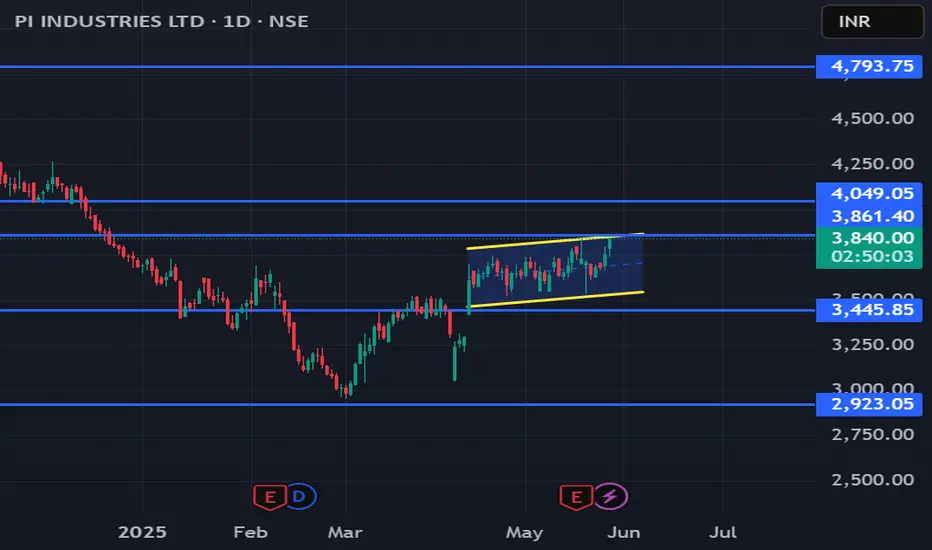
PIIND: Channel Breakout Above 3840Details:
Asset: PI Industries Ltd (PIIND)
Breakout Level: 3840
Potential Targets: 4000, 4500, 4700
Stop Loss: 3740
Timeframe: Short to Medium Term
Rationale: PIIND has broken out from a well-defined ascending channel on the daily chart. The breakout above 3840 is supported by strong volume and bullish price action.
Market Analysis:
Technical Setup: Sustained breakout from the channel with follow-through buying indicates strength.
Sector Trend: Agrochemical stocks are witnessing renewed interest due to strong demand and monsoon expectations.
Risk Management:
Stop loss at 3740 to protect against false breakout or trend reversal.
Risk-Reward Ratio:
Favorable, offering a potential return of 1:2.5 or more based on targets.
Watch for strong daily closes above 3840 and increasing volume for confirmation of trend continuation.
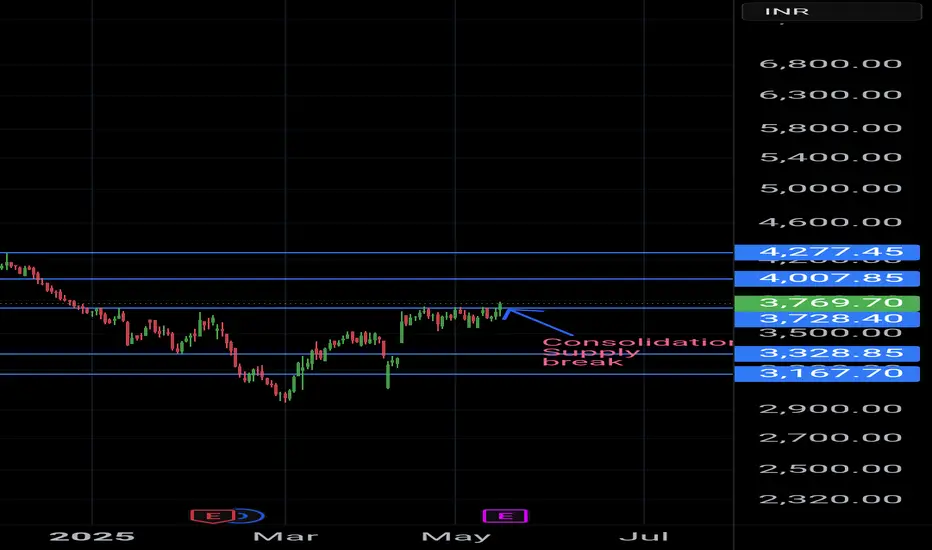
PI Industries looking up to reach 4200 in short to long termPI industries has broken the resistance level after a solid consolidation for more than one month. The bullish engulfing candle has come past the resistance level. It should come down to test the same level and progress towards 4200 in short to long term.

the rally is overPI Industries CMP 3607
Directional Signal - The V shaped fall is a directional signal and is asking u to be careful.
Elliott - the sharp fall is just the 1st wave of A. The rally is the 2nd wave which means the stock will not start the devastating 3rd wave down.
Fibs- the rally is just 38.2%, indicating weakness.
RSI - the break of the support and now below the averages is very negative.
MA - the negative crossover is about happen. Mind u this is the monhly chart. The negative crossover will be devastating here.
The hourly chart is clearly saying this rally is corrective in nature and is complete.
Conclusion - u wont get a better exit. Take it here.

PIIND : Below Averege results, upside may be capped
Q3 results are out. Volatility (IVP) is still high in the stock
Zone of 3300 seems strong support (followed by 300 zone)
On upside, 3700 then 3800-3900 looks like strong resistance
Max Call OI build up at 3700 levels too (as of today) and Max Put OI seems to be around 3500, then 3400/3300 too.
Completely sideways trend, with no trend strength either.
#stoxsense

False Breakdown :PI IndustriesA False Breakdown occurs when the price moves through a certain level but doesn't continue to accelerate in that direction.
This is because the price does not have enough momentum and the selling interest at this level is not high enough to keep pushing the price in that direction.
Instead, the market reverses!
Weekly Timeframe:
Fake breakdown
Daily Timeframe:
PI Industries is also showing Bullish Divergence in Daily time frame.
It Broke last swing high, but fail to close above that swing high,
If in coming days, it close above it then it good to go long.

PIIND BullishAs we observe on Daily time frame of PIIND its trading at Demand zone expecting a bounce back levels are marked on chart. just a view not a reco... this study is based on supply and demand.

PI Industries Clear trendlineClear support on weekly charts.
PE ratio is below 10 years average
Great valuation

PII INDUSTRIES : NEAR COMPLETION OF A BULLISH HARMONIC PATTERN PII INDS - The ongoing decline in the stocks seems near to the exhaustion and would offer a highly favourable Risk:Reward trade opportunity.
The stock is near to the completion of the Bullish BAT Harmonic Pattern with the PRZ placed around 3650-3550.
Following the patterns, stock would attract fresh buying momentum around the same and could result into quick pullback rally.

PI Industries at Weekly & Monthly SupportPI Industries is at its promising Weekly Support for the Fourth time and Monthly Support as well
Structure seems interesting.
One of the top firms in agrochemical and Pharma Chemicals space.
Please do your own research before taking even a small stake.

PI INDUSTRIES good to buy?The daily chart of PI INDUSTRIES shows that the stock is in wave 4 of an impulse.
Wave 3 is a terminal impulse in this case as it is less than 161.8% (see fib extension in green).
And as per the rule, wave 4 of any terminal impulse can overlap with wave 1. Also, wave 4 can retrace to 50%.
We have done detailed counting, and we can see that the price is near 50% of the fib retracement of the impulse.
At this level, we can see wave C of wave 4 is standing at 127% extension. It is possible that the price can fall a little further up to 161.8% extension. (See fib extension in blue).
The conclusion is that an aggressive trader can enter between the zone of 50% (see in black) fib retracement and 161.8% (see in blue) fib extension.
For conservative entry, one can wait for the price to break and sustain above 38.2% (see in black).
The stoploss for both entries will be below 61.8% (see in red). This is quite logical because wave 4 will never close below 61.8%
Meaning, the 61.8% level is an invalidation point for all this counting and the price will fall further if it breaks 61.8%
This analysis is based on Elliott wave theory and Fibonacci.
This analysis is for educational purposes only.
This is not any buying recommendation. Please always do your research before taking any trade.

PIIND - TOP IS done?PIIND: CMP 4570
It appears that the TOP is done.. 5 wave impulse from 2014 lows of 130 levels seems to be over now..
Chart is attached with counts for easy understanding.
On daily, diagonal is visible..
MACD crossover seen on Weekly TF with Double top/Divergence
On daily, Harmonic Pattern could potentially play out as copied below..
Views are personal and for learning purpose only and not a BUY/SELL recommendation. I am not SEBI Registered.. Please consult your Financial Advisor for investment decision

Education purpose only - PIINDStock is at a major support
Given a pull back in a long journey of uptrend
Should go up fast..
Lets see how the hypothesis will play.

PI IndustriesBreakout from a descending channel.
Overall it is moving in an ascending channel.
I like the consolidation, I like the script.

PI IND TARGET 5213 STOPLOSS 4600Script monthly long term breaout in the raising wedge and confirmed by weekly open and closing. Next target is 5213
