PI Industries Ltd. PI Industries Ltd. The stock is trading above the resistance level and at 52 weeks high. Technical indicators are bullish. ***TRADINGEDGE TIME-TREND INDICATOR IS BULLISH*** ***TE BANDS ARE IN GREEN ZONE*** If price trades above 1990 level more upside is expected. KEEP AN EYE!! #tradingedge_academy #SMTA_institute ***this is my personal view. Please take advice from your financial advisor before investing. by Garey_Singh7
PI Industries - Verge of a breakoutAnother strong company which is doing very well is on the verge of a breakout. Long above 1640 with SL below 1590. by rdkriplani0
PI Industries - Buy Idea if able to sustain above 1655Buy PI Industries if it sustains above 1655 for long term target of 2000 plusby KapilVP1
Short PI Industries.The stock already gave a breakdown. It also crossed 200 EMA. We will have to wait for the stock to cross the trend line because we have a green Ichimoku cloud support in 1-hour timeframe which might act as support and stock might bounce back.Shortby Sarthak_Singh2
PIIND Look for shorting PIIND at major resistance. Look for any reversal candle sticks pattern for shorting opportunity Levels mentioned on chartShortby ProjectWealth0
PI Industries - Momentum above 1550 As i have been bullish for the longest time in the chemical space, another company which could do well in this space. Long above 1550 where it could catch some major momentum for a quick move up. SL 2% below purchase price. by rdkriplani0
PIIND can touch Rs 1125buy around @1080 target1- 1095 target2- 1110 target3- 1124 stoploss - below 1065Longby SatishJaiswalUpdated 0
#PIINDQueryBuilder: 28/02/2020 : Weekly exit based on Momentum Loss + Strength C less than EMA5by krishnakhanna0
#PIINDMomentum restores on D and W timeframe Strength close > EMA 5 CCI W > 100 PinBar Broken with strengthby krishnakhanna2
#PIINDMomentum restores on D and W timeframe Strength close > EMA 5 CCI D > 100 BO12 formed .. bottom confirmedby krishnakhanna2
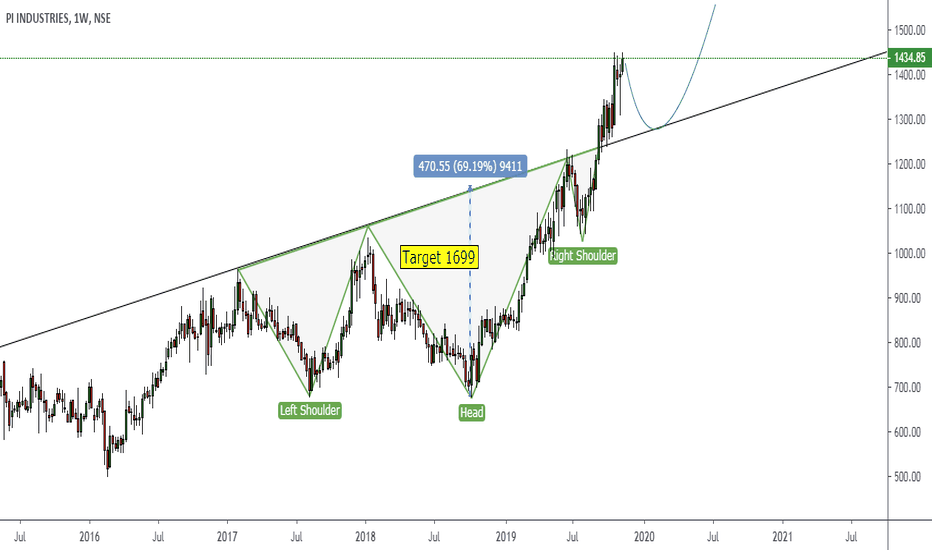
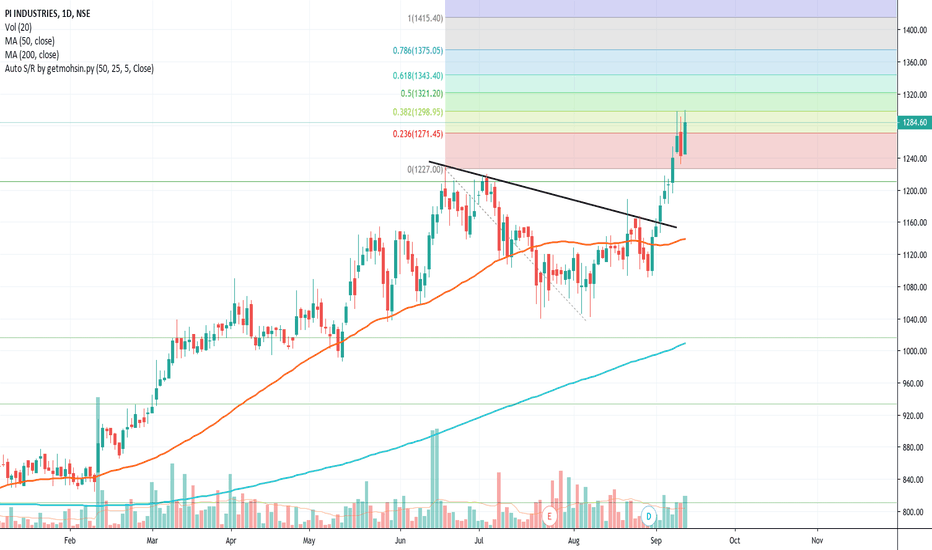
Breakout in PIINDThere is breakout in PIIND There might be some retracement at this all time high level. Once it crosses its all time high, it can go further up and achieve the target as per show on the chart by Fibonacci toolEducationby utkarsh1979Updated 0
PI IND BULLISH DIVERGENCEPI IND Showing bullish divergence on hourly chart, bouncing of support 1232 twice. Wait and watch for confirmation signal above 50 RSI.Longby AnandJage0
PI INDS - TOWARDS NEW HIGHS??PI INDS DAY CHART SUGGEST THE SHAE PRICE IS INTERESTED TO GO FOR NEW HIGHS. LET THE TRADING BE DONE ABOVE 1230 LEVELS, THEN ENTRY CAN BE DONE WITH A MEDIUM TERM TARGET OF 1400.by Sunandamedi0
This is just for education purpose: Details are mentioned on chart. Trade own your risk. this is just for information and education purpose.Longby paytience0
Ultra bullish chartStrong support at 928. Presently crossed resistance and this becomes support at 1172. Intermediate term target is 1450 or above. Longby sabyasachi_nath6
Long Turm Investment After Sideways Zone Breakout in PI INDUSTRISideways Zone Breakout in PI INDUSTRI above 1750. Also it is in a strong Uptrend from 2018.Longby swapnilchoksi5