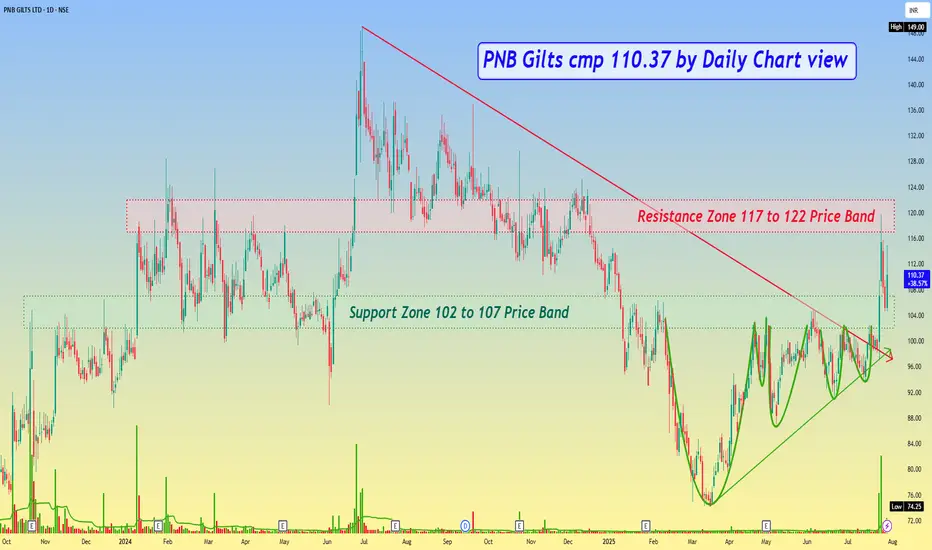
PNB Gilts cmp 110.37 by Daily Chart viewPNB Gilts cmp 110.37 by Daily Chart view
- Support Zone 102 to 107 Price Band
- Resistance Zone 117 to 122 Price Band
- Volumes are seen spiking heavily over past few days
- Support Zone is getting tested retested since last week
- Bullish Technical Chart indicates decent breakout probability
- Fal
18.87 INR
2.33 B INR
16.76 B INR
42.89 M
About PNB Gilts Limited
Sector
Industry
CEO
Pareed Sunil
Website
Headquarters
New Delhi
Founded
1996
ISIN
INE859A01011
FIGI
BBG000F933R4
PNB Gilts Ltd. engages in trading of securities. Its primary activities entail supporting government borrowing program via underwriting of government securities issuances and trade in a gamut of fixed income instruments, such as government securities, treasury bills, state development loans, corporate bonds, interest rate swaps and various money market instruments, such as certificates of deposits, commercial papers. The company was founded on March 13, 1996 and is headquartered in New Delhi, India.
Related stocks
PNB Gilts Breakout + Dividend & Earnings Buzz!PNB Gilts has broken out of a long-term consolidation after years of sideways action. Price has reclaimed the ₹90 zone and is now trading above ₹108 — showing strong momentum backed by volume.
📊 Technical Highlights:
✅ Breakout above multi-year resistance zone (₹80–₹90)
🧱 Resistance ahead: ₹130–₹

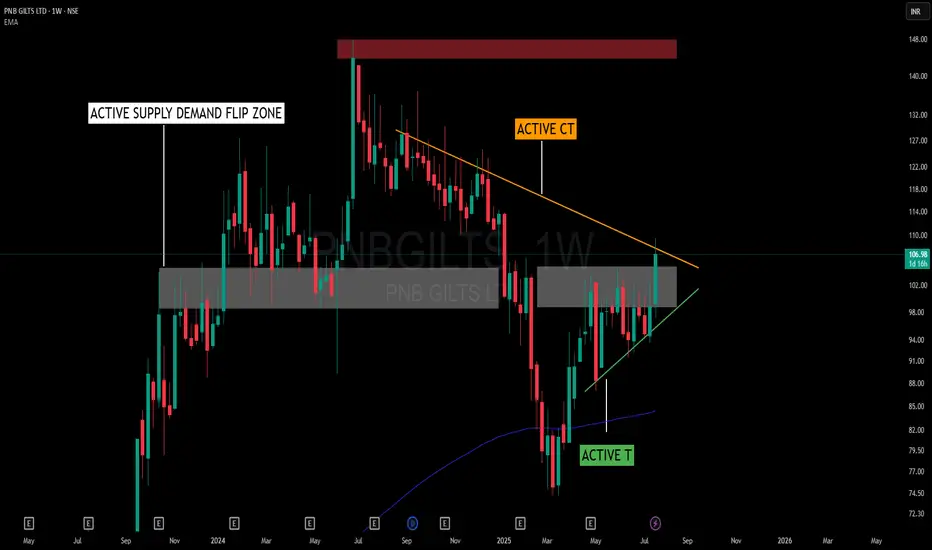
Squeezed by Structure – When Trendlines and Flip Zones CollideThis chart presents an interesting interaction between structure and zone dynamics without adhering to a textbook pattern name. The price is being squeezed within a random, yet well-defined structural form, shaped by the forces of support and resistance.
📌 Key Structural Notes:
🟠 Active Counter Tr
PNB Gilts Might CorrectPNB Gilts might correct in recent days to come. Here are the technical reason :
1)Trading below 20 EMA & 50 EMA on daily chart
2)Head & Shoulder Pattern formation on daily chart
3)On Monthly chart it's negative with 117.8 as last month low(August) which is an important support level.
(Note: Not

Pnb Gilts Limited - Breakout Setup, Move is ON...#PNBGILTS trading above Resistance of 136
Next Resistance is at 180
Support is at 92
Here are previous charts:
Chart is self explanatory. Levels of breakout, possible up-moves (where stock may find resistances) and support (close below which, setup will be invalidated) are clearly defined.

Pnb Gilts Limited - Long Setup, Move is ON...#PNBGILTS trading above Resistance of 103
Next Resistance is at 136
Support is at 84
Here is previous chart:
Chart is self explanatory. Levels of breakout, possible up-moves (where stock may find resistances) and support (close below which, setup will be invalidated) are clearly defined.
Disc

PNBGLITS | Multi Pattern Breakout | Multi Timeframe BreakoutChart Analysis - Daily Timeframe
1) Ascending triangle breakout given good range
2) Breakout - consolidation - Breakout
3) Taking good volume support
Chart Analysis - Weekly Timeframe
1) Pole and Flag formation breakout
2) Ascending triangle breakout - consolidation - breakout happening

Breakout in Pnb Gilts Limited...Chart is self explanatory. Levels of breakout, possible up-moves (where stock may find resistances) and support (close below which, setup will be invalidated) are clearly defined.
Disclaimer: This is for demonstration and educational purpose only. This is not buying or selling recommendations. I am

Triangle Resistance Breakout - PNBGILTSPlease look into the chart for a detailed understanding.
Consider these for short-term & swing trades with 2% profit.
For BTST trades consider booking
target for 1%-2%
For long-term trades look out for resistance drawn above closing.
Please consider these ideas for educational purpose
Please n

Looking good above 105 for upside
volume is decent let it break 105 zone & sustain above it for 1hour then enter , it can give decent 8-10% return

See all ideas
Summarizing what the indicators are suggesting.
Oscillators
Neutral
SellBuy
Strong sellStrong buy
Strong sellSellNeutralBuyStrong buy
Oscillators
Neutral
SellBuy
Strong sellStrong buy
Strong sellSellNeutralBuyStrong buy
Summary
Neutral
SellBuy
Strong sellStrong buy
Strong sellSellNeutralBuyStrong buy
Summary
Neutral
SellBuy
Strong sellStrong buy
Strong sellSellNeutralBuyStrong buy
Summary
Neutral
SellBuy
Strong sellStrong buy
Strong sellSellNeutralBuyStrong buy
Moving Averages
Neutral
SellBuy
Strong sellStrong buy
Strong sellSellNeutralBuyStrong buy
Moving Averages
Neutral
SellBuy
Strong sellStrong buy
Strong sellSellNeutralBuyStrong buy
Displays a symbol's price movements over previous years to identify recurring trends.
Frequently Asked Questions
The current price of PNBGILTS is 90.07 INR — it has decreased by −7.77% in the past 24 hours. Watch PNB Gilts Limited stock price performance more closely on the chart.
Depending on the exchange, the stock ticker may vary. For instance, on BSE exchange PNB Gilts Limited stocks are traded under the ticker PNBGILTS.
PNBGILTS stock has fallen by −6.46% compared to the previous week, the month change is a −10.11% fall, over the last year PNB Gilts Limited has showed a −24.02% decrease.
PNBGILTS reached its all-time high on Jun 28, 2024 with the price of 149.25 INR, and its all-time low was 10.91 INR and was reached on Jul 31, 2006. View more price dynamics on PNBGILTS chart.
See other stocks reaching their highest and lowest prices.
See other stocks reaching their highest and lowest prices.
PNBGILTS stock is 9.99% volatile and has beta coefficient of 1.75. Track PNB Gilts Limited stock price on the chart and check out the list of the most volatile stocks — is PNB Gilts Limited there?
Today PNB Gilts Limited has the market capitalization of 17.58 B, it has decreased by −2.12% over the last week.
Yes, you can track PNB Gilts Limited financials in yearly and quarterly reports right on TradingView.
PNBGILTS net income for the last quarter is 1.60 B INR, while the quarter before that showed 750.20 M INR of net income which accounts for 113.37% change. Track more PNB Gilts Limited financial stats to get the full picture.
Yes, PNBGILTS dividends are paid annually. The last dividend per share was 1.00 INR. As of today, Dividend Yield (TTM)% is 1.02%. Tracking PNB Gilts Limited dividends might help you take more informed decisions.
PNB Gilts Limited dividend yield was 1.24% in 2024, and payout ratio reached 7.72%. The year before the numbers were 0.91% and 25.93% correspondingly. See high-dividend stocks and find more opportunities for your portfolio.
As of Oct 17, 2025, the company has 53 employees. See our rating of the largest employees — is PNB Gilts Limited on this list?
EBITDA measures a company's operating performance, its growth signifies an improvement in the efficiency of a company. PNB Gilts Limited EBITDA is 4.54 B INR, and current EBITDA margin is 97.19%. See more stats in PNB Gilts Limited financial statements.
Like other stocks, PNBGILTS shares are traded on stock exchanges, e.g. Nasdaq, Nyse, Euronext, and the easiest way to buy them is through an online stock broker. To do this, you need to open an account and follow a broker's procedures, then start trading. You can trade PNB Gilts Limited stock right from TradingView charts — choose your broker and connect to your account.
Investing in stocks requires a comprehensive research: you should carefully study all the available data, e.g. company's financials, related news, and its technical analysis. So PNB Gilts Limited technincal analysis shows the strong sell today, and its 1 week rating is sell. Since market conditions are prone to changes, it's worth looking a bit further into the future — according to the 1 month rating PNB Gilts Limited stock shows the neutral signal. See more of PNB Gilts Limited technicals for a more comprehensive analysis.
If you're still not sure, try looking for inspiration in our curated watchlists.
If you're still not sure, try looking for inspiration in our curated watchlists.