PNBHOUSING trade ideas

PNBHOUSING LOOKING BULLISHActive White marubozu Bullish candlestick spotted in PNB housing. A White Marubozu is a one day bullish indicator that moves upward and is considered very bullish. Buy at CMP, target:880, sl: 574.

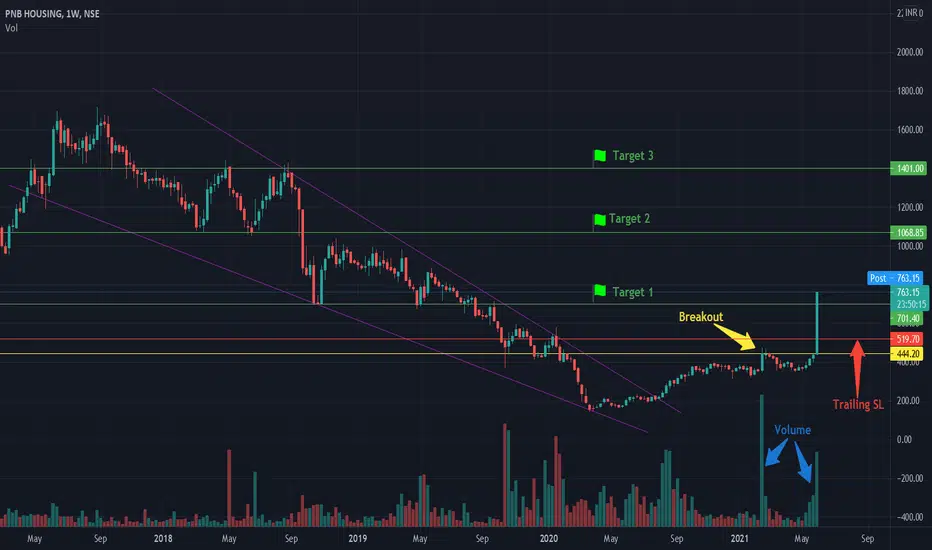
Target 1 (72%) achieved in PNB Housing Finance. Target 2 is ON.This is follow-up on PNB Housing Finance. Can check link to related ideas.
Target 1 achieved. More than 72%. Target 2 is ON.
Chart is self explanatory. Entry, Targets and Trailing Stop Loss are mentioned on the chart.
Disclaimer: This is for demonstration and educational purpose only. This is not buying or selling recommendations. I am not SEBI registered. Please consult your financial advisor before taking any trade.
PNBHOUSING At Weekly Resistanceit has broken long term trendline with back to back UC. now it is currently at Resistance.
We may see a consolidation or profit booking at current level.
RSI also into overbought zone on weekly chart.
either it can have pull back upto 570 level. or consolidate at current level and further breakout at 700.

PNBHOUSING | BO with Vol. Good for 11%*Price has broken out of consolidation after a period of volume dry-up. Above 399, can give an upside of 11% to 446. SL 361
Thank you. Leave a like if you found this helpful.

PNB Housing Finance Huge BreakoutThis subsidiary of Punjab National Bank had fallen on bad days ever since PNB's fall after Nirav Modi case. However, PNB was in the market to sell the stake.
Now marquee investors Aditya Puri and Carlyl group have decided to invest.
It has given a breakout from CNH formation on the weekly chart. Narrative on the chart. Should reward long term investors.
Disclaimer: This is not a suggestion to buy or sell. For educational purpose only.


Descending triangle pattern formation Trend: End of Short downward trend
We have seen a descending triangle pattern in PNB Housing which has formed between 15th Feb 21 - 10th May 21. On 11th May, it broke the resistance level forming a green candle and with good volume. The green candle formed on the 12th of May confirms the positive breakout.
Buy price: 382-385
Initial Stoploss: Aroung 360
Total Predicted upward move from breakout = 27% (Price level of around 465)
Target1: Around 398
Target2: Around 415
Target3: Around 435
Target4: Around 450


#PNBHOUSING #50%+ #DHFL #LICHSGFIN #FINANCE #LOAN #HOUSINGFIN #PNBHOUSING
NSE:PNBHOUSING
CMP: 372.35
Target: 584
Stop Loss: 306
Time Frame: Less than 3 months
Factors:
Rising Volume with rising Prices.
Flag pattern breakout.
Pennant Pattern Breakout with Bullish Candle.
Retest Successful.
Higher High & Higher Low.
Broken above RESISTANCE
Trading at SUPPORT .
Fundamentals are strong.
Risk Return Ratio is healthy.
And
Bullish Wedge FLAG formed.
Compare with peers NSE:LICHSGFIN , NSE:DHFL , NSE:IBULHSGFIN , NSE:HDFC , NSE:HUDCO .
If you like my work KINDLY LIKE SHARE & FOLLOW this page for free Stock Recommendations.
With 💚 from Rachit Sethia

PNB HOUSING - BUY - SWING TRADE1. BROKEN TRENDLINE AND RETESTED
2. CONSOLIDATED IN RANGE FOR SOLID 4 DAYS
3. PRICE MOVEMENT SIDEWAYS BUT RSI MAKING HIGHER LOWS
4. BULLISH PIN BAR FORMED
CMP BUY 357.65
SL 354
TARGET 375


PNB Housing: Descending Channel Breakout (TF-1W)PNB Housing- Descending Channel Breakout
Chart time frame -1 week
Trade type -short term
Duration - 3 months
Entry - 432
Target 1 - 574
Target 2 - 698+
Stoploss - 393
Risk:Reward - 1:3
Disclaimer: All charts are purely for educational and information purpose only. Invest or trade at your own risk.

Breakout in PNB Housing Finance...Chart is self explanatory. Entry, Targets and Stop Loss are mentioned on the chart.
Disclaimer: This is for demonstration and educational purpose only.

PNB HOUSING CHARTSSelf explnatory charts.. small stop loss big targets.. it will be multi year breakouts.
PSU in Flavour...
will definitely go up..


PNBHOUSING- RECTANGLE BREAKOUTPNBHOUSING- daily chart forming just wonderful rectangle pattern and we can treat the same pattern as cup and handle too and now stock trading above breakout level with multi-time jump in volume. Now stock can move towards 460/520 levels with the help of 365 support levels on the chart pattern.

BUY PNB HOUSING PNB Housing Finance Ltd., incorporated in the year 1988, is a Mid Cap company (having a market cap of Rs 6264.33 Crore) operating in NBFC sector.
Recently Singapore-based Investment Opportunities V raises stake in PNB Housing Finance to 9.92%.
PNBHF has been on a downtrend since 2017 and now looks like the trend has changed.


