Privi Speciality Chemicals Ltd.(PRIVISCL)Time Cycle is a routine that allows you to map the movement of a stock by measuring the high and low levels of the stock on a day or period. However, it does not prove whether a reversal will occur in the next time cycle; it is only a probability. But it makes you profitable 80% of the time.
Regardless of the outcome, the candle formed on the day of the time cycle carries significant significance. The market respects this candle, whether it goes up or down, which is very important. Time Cycle often stops short near the candle. You will notice on the chart that it often looks like a support or resistance area.
Time Cycle candles also tell you about continuation or reversal, but you have to forgive the high and low of the candle formed in the time cycle.
You do not have to make any decisions yourself. This is its specialty.
Privi Speciality Chemicals Limited
No trades
Trade ideas

BUY TODAY SELL TOMORROW for 5%DON’T HAVE TIME TO MANAGE YOUR TRADES?
- Take BTST trades at 3:25 pm every day
- Try to exit by taking 4-7% profit of each trade
- SL can also be maintained as closing below the low of the breakout candle
Now, why do I prefer BTST over swing trades? The primary reason is that I have observed that 90% of the stocks give most of the movement in just 1-2 days and the rest of the time they either consolidate or fall
Trendline Breakout in PRIVISCL
BUY TODAY SELL TOMORROW for 5%

Privi Speciality Chemicals Ltd - Breakout Setup, Move is ON...#PRIVISCL trading above Resistance of 3196
Next Resistance is at 4757
Support is at 2166
Here is previous chart:
Chart is self explanatory. Levels of breakout, possible up-moves (where stock may find resistances) and support (close below which, setup will be invalidated) are clearly defined.
Disclaimer: This is for demonstration and educational purpose only. This is not buying or selling recommendations. I am not SEBI registered. Please consult your financial advisor before taking any trade.

PRIVISCL Price actionPRIVISCL (Privi Speciality Chemicals Ltd) is currently trading with a price near ₹2,520–₹2,730, showing recent volatility with a slight downward bias. The stock touched a 52-week high at ₹2,660 in August 2025 and experienced a notable pullback from that level. On October 15, it closed at ₹2,539, after reaching a low of ₹2,505 during the session. Average daily volumes are moderate, and the deliverable percentage remains healthy, typically above 75%.
Short-term price action reflects a decline of about 8% over the past month and roughly 6% over the last week. However, the yearly performance remains strong, with a rise of 49% in the past 12 months, beating many industry peers. The company’s fundamentals show premium valuation levels with a trailing PE over 45, and the stock trades at nearly 10 times its book value. Market capitalization is around ₹9,600–₹10,700 crore, and debt remains moderate at a ~1:1 ratio. No promoter shares are pledged.
Earnings are solid: EPS has grown over 34% annually for the past three years, and EBIT margins have improved from 13% to 16% in recent quarters. Net income for the last quarter came in at ₹619 million, with revenue growth supported by positive operating trends. The company pays a small annual dividend, with the last payout at ₹5 per share, offering a modest yield.
Overall, PRIVISCL is fundamentally strong, but the recent pullback suggests short-term consolidation after a robust rally. Valuations are elevated, so price movement may remain volatile; long-term outlook is supported by growth in profitability and margins, with analysts maintaining high price targets above current levels.
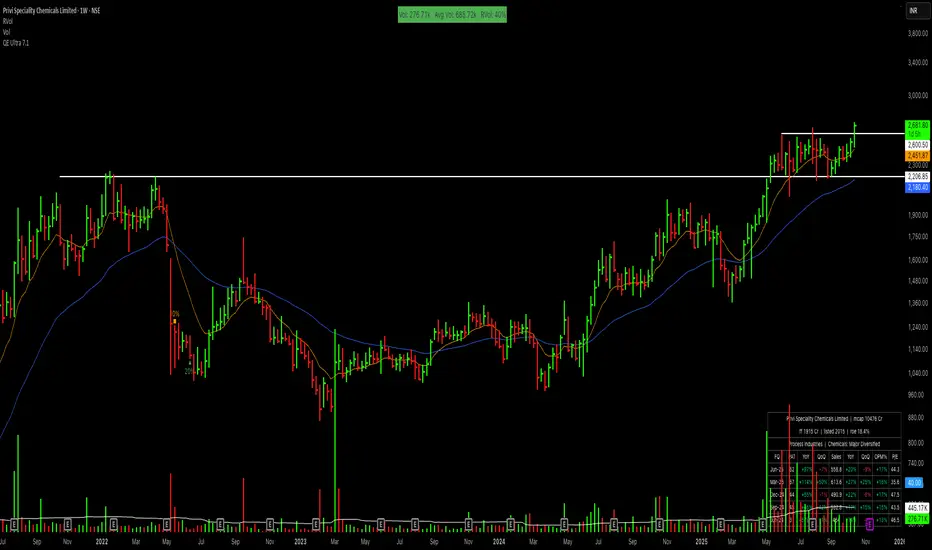
Privi Speciality Chemicals Ltd – Weekly Breakout SetupPrivi has shown a clean breakout from a long consolidation zone, backed by steady volume expansion. After months of range-bound action, the stock finally broke above ₹2,600 and is now sustaining well above its breakout zone — indicating the start of a new upward leg.
Price action shows strong bullish candles supported by the 10- and 20-week EMAs, signaling trend confirmation.
🎯 Key Levels:
CMP: ₹2,903 (+2.55%)
Breakout Zone: ₹2,500 – ₹2,600
Target Zone: ₹3,150 – ₹3,250
Stop-Loss: ₹2,700 (weekly close basis)
📊 Technical View:
Weekly breakout from multi-month consolidation box.
Volume confirmation supports sustained momentum.
Price trading above both EMAs, confirming bullish trend continuation.
Minor resistance near ₹2,950; sustained move above can accelerate momentum.
🧠 View:
Privi Speciality Chemicals has completed a strong breakout after a long accumulation phase. Sustaining above ₹2,900 can push the stock towards ₹3,200 levels in the coming weeks.

PRIVISCL Large Base Breakout + Broke the Previous Earnings Candle !
Possibly setting up for a New Upward Leg.
Look at this........i already make a entry 🧪 Fundamentals / Business Snapshot
What they do: Privi Speciality Chemicals is a major Indian manufacturer, exporter, and supplier of aroma & fragrance chemicals. Their capability includes many complex operations (distillation, condensation, hydrogenation etc).
Recent financials:
• In FY25, revenue rose ~ 19.9 % to ~ ₹2,101.19 crore from ~ ₹1,752.23 Cr prev year.
• Net profit nearly doubled—~ 97 % YoY to ~ ₹187.00 crore vs ~ ₹94.91 Cr the previous year.
• In the most recent quarter (Q1 FY26), revenue ~ ₹567.80 Cr (up ~21.7 % YoY), net profit ~ ₹61.93 Cr (up ~97.4 % YoY).
Margins / Efficiency:
• Operating / EBITDA margins have improved. For example, in recent quarters the OPM has been ~ 20-23 % in some reports.
• ROE recently ~ 16.94 % vs its 5-yr average ~11.8 %.
Risks / concerns:
• Some analysts / rating agencies see weaker long-term fundamentals: slow growth in net sales / operating profit over longer horizon, high debt/EBITDA in some reports.
• Commodity input risk, foreign exchange risk (since exports are significant), margin pressure possible. (General for speciality chemicals)
Competitive / strategic positives:
• Strong R&D, product mix improvements.
• Export orientation gives access to global markets.
---
📊 Technical / Price Action View
Current trend & moving averages: According to ETMoney, the stock is hovering around key moving averages: the 20, 50, 100, 200-day EMAs/SMAs are giving “neutral” signals in many cases.
Momentum indicators:
• RSI (14) ~ 48-50 area → neutral territory.
• MACD in some sources is slightly negative or weak → indicates not strong momentum up currently.
• Some resistance / support zones via pivot / classic technical tools: TipRanks shows pivot at ~ ₹2338, with resistance above and support below.
Recent behaviour:
• The stock has hit 52-week highs in recent past, showing strong sentiment after good results.
• However, price also seems to be consolidating / facing short-term corrections (QoQ revenue drops, expenses growth) in some quarters.
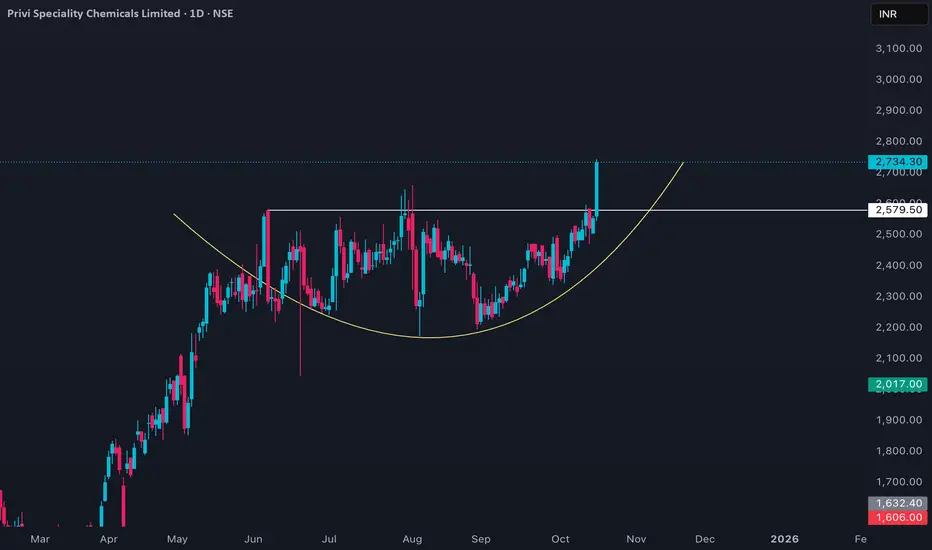
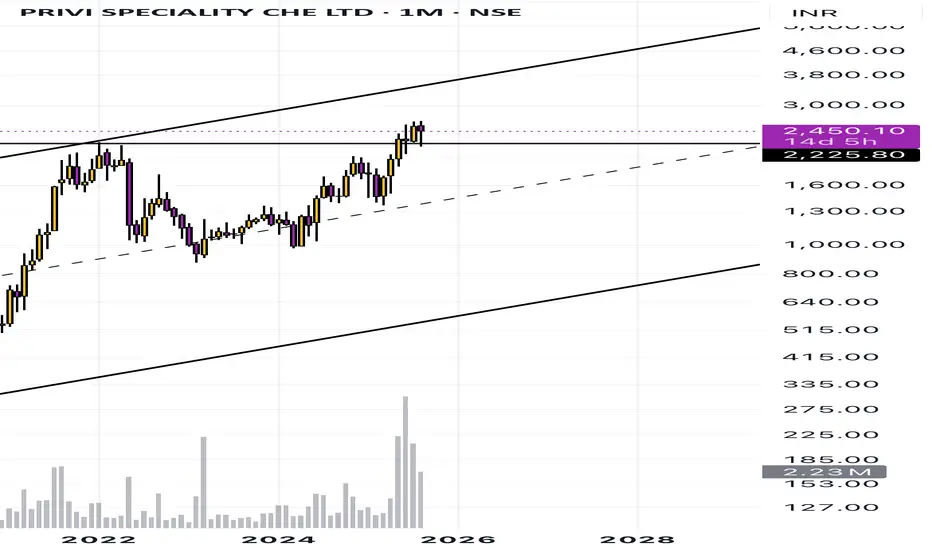
Privi Speciality The chart shows a rounding bottom on monthly tf and price sustaining above breakout on technical basis i expect
Targets of 3400 and 5000 in a longer horizon
Privi Speciality Chemicals Ltd. (PRIVISCL)This is Privi Speciality Chemicals Ltd. weekly chart.
As you can see the:-
In order to draw curved trend line we always require 3 consecutive pivots.
As you can see, by creating a simple trend line we were not able to get the correct starting future point.
Now we insert the third point in the curved line. Thus, we easily get the fourth support point in the future.

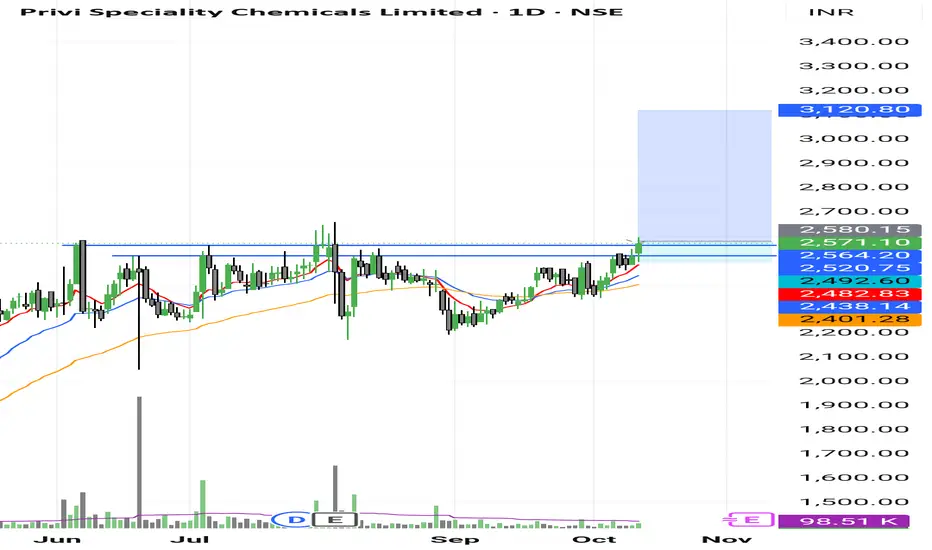
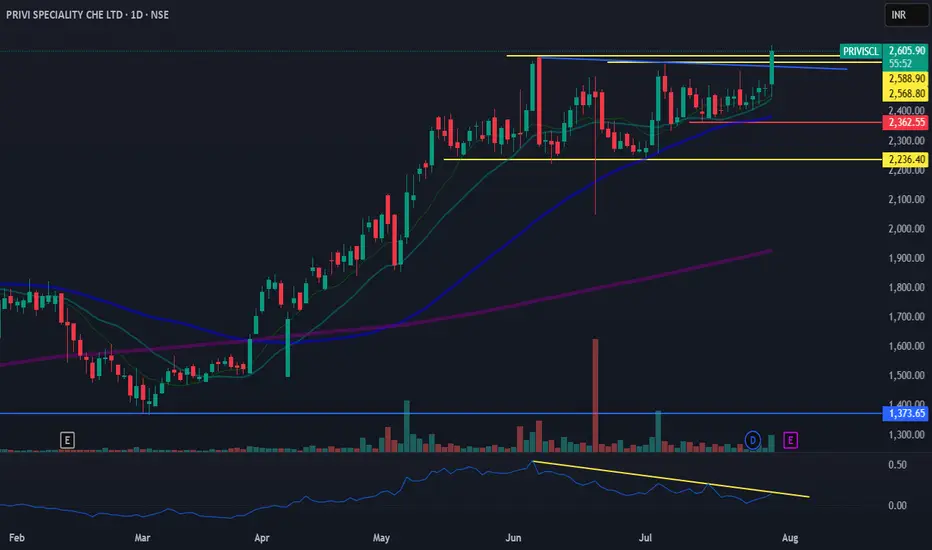
PRIVISCL stage 2 continuation breakoutPRIVISCL stage 2 continuation breakout
Entry 2565-2640
SL 2363
Only for journaling, not a trading/investing tip.
This post is for my personal use.
Note : only for learning, not a trading recommendation. i am posting as a trading journal for learning before and after breakout.
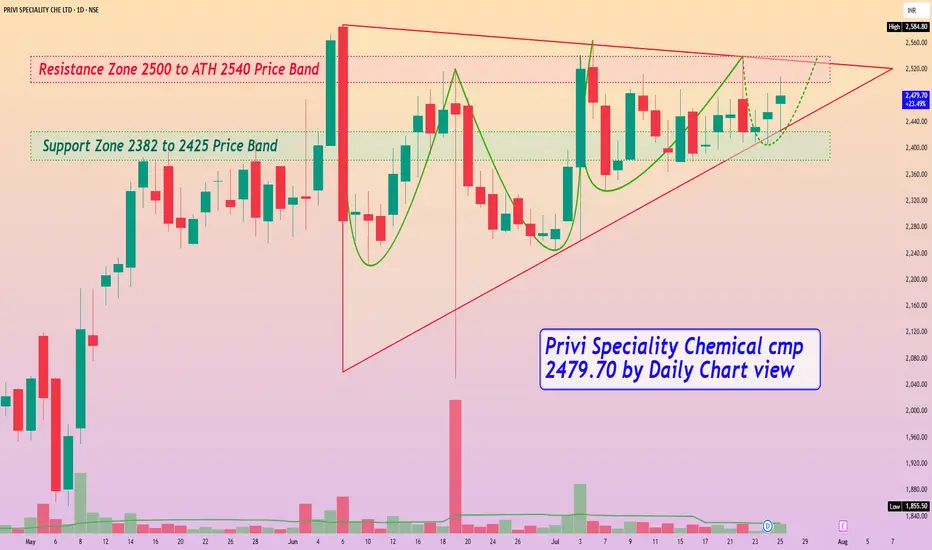
Privi Speciality Chemical cmp 2479.70 by Daily Chart viewPrivi Speciality Chemical cmp 2479.70 by Daily Chart view [/ b]
- Support Zone 2382 to 2425 Price Band
- Resistance Zone 2500 to ATH 2540 Price Band
- Ascending Triangle pattern Breakout in the making process
- Very considerate VCP pattern seems formed on the stock chart
- Volumes seen getting in close sync with the average traded quantity
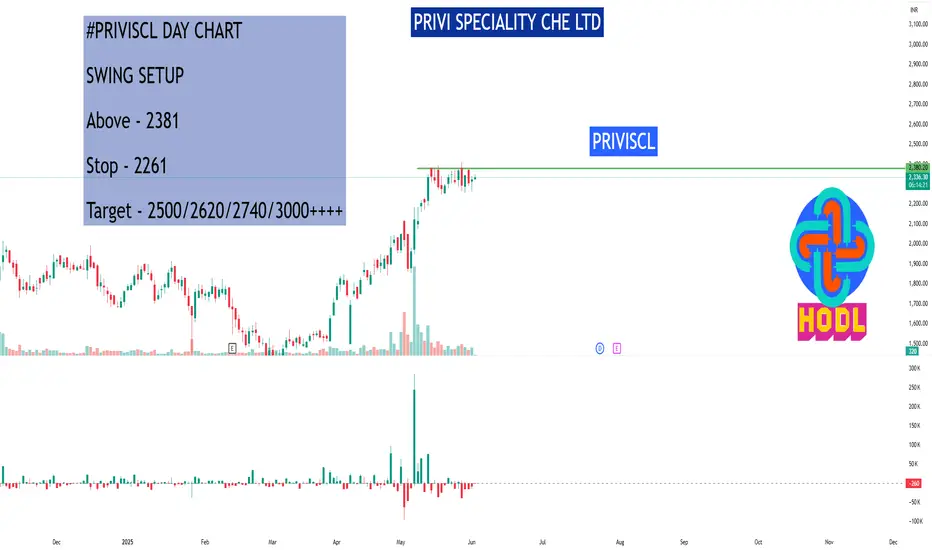
PRIVI SPECIALITY CHE LTD#PRIVISCL DAY CHART
SWING SETUP
Above - 2381
Stop - 2261
Target - 2500/2620/2740/3000++++
Disclaimer:
This is not financial advice. Please do your own research or consult with a financial advisor before making any investment decisions. Investments in stocks can be risky and may result in loss of capital.
Price Action - Privi SpecialityPrivi Speciality chart is making Higher High and Higher Low formation.
Can Buy above 1945 level and keep stop loss at 1850 level.
On Weekly chart it has come out of long base.
Shall go long agrresively above 1945 level.

PRIVISCL: Strong Buy Zone with Breakout PotentialTitle: "PRIVISCL: Strong Buy Zone with Breakout Potential – Backed by Excellent Financials"
Stock: Privi Speciality Chemicals Ltd. (PRIVISCL)
Analysis:
Privi Speciality Chemicals is currently trading in a Buy Support Zone on the daily timeframe, offering a potential entry point for traders. The stock is backed by strong financial performance, with:
Quarterly Revenue: ₹522 Cr, a 20.2% YoY growth.
Quarterly Net Profit: ₹47 Cr, a robust 75.1% YoY growth.
Ownership Changes:
Promoter Holdings: Increased from 72.72% to 74.05%, reflecting strong confidence in the company’s growth potential.
FII/FPI Investors: Increased from 29 to 33 in Sep 2024 quarter.
Institutional Investors: Marginal decrease from 3.26% to 2.92%, with Mutual Fund holdings slightly reduced from 2.59% to 2.29%.
This combination of strong fundamentals and promoter confidence suggests a high likelihood of a breakout soon.
Technical Setup:
Trend: The stock is consolidating at support, poised for a potential upward move.
Volume: Watch for an uptick in volume to confirm the breakout.
Trade Plan:
Entry: At CMP or on breakout above resistance.
Target: Initial target at ₹1430; mid-term target at ₹1500.
Stop Loss: Below the support zone at ₹1280.
Note: With excellent financials and growing promoter confidence, PRIVISCL is well-positioned for an upside breakout.

PRIVI SPECIALITY CHE#PRIVISCL
Looking good with decent volume,
focus if the stock breaks 1815 level
with the target of 1870 and 1930

PRIVISCL - Weekly AnalysisIn the Weekly Chart of PRIVISCL ,
we can see that, it has given Inverted H&S breakout.
Let it retest and the enter with SL & Targets.

PRIVISCL𝐓𝐨𝐩 𝐁𝐫𝐞𝐚𝐤𝐨𝐮𝐭 𝐒𝐭𝐨𝐜𝐤𝐬 𝐅𝐨𝐫 𝐓𝐡𝐢𝐬 𝐖𝐞𝐞𝐤 ⬇️
🔸𝗣𝗥𝗜𝗩𝗜𝗦𝗖𝗟
-capex is up and borrowings are down
-highest ever sales and sustained margins above 20%
-increased cash from operations year over year

PRIVISCLPRIVISCL LTD
CMP 1763
3 month consolidation zone breakout
Breakout with volume
Can be a bull trap if not sustain above 1750
History of falling after Results.

Upside Breakout in Privi Speciality Chemicals LtdPrivi Speciality Chemicals Ltd NSE:PRIVISCL
The price has broken upward out of a trading range, suggesting the beginning of a new uptrend.
The Upside Breakout pattern features a trading range where prices move sideways between two parallel horizontal lines. This pattern typically indicates a pause or congestion area within an existing trend, though occasionally it results in a reversal of the previous trend.
Regardless, an upside breakout through the upper resistance line signals the end of the consolidation period and the onset of an uptrend.
PLEASE NOTE THAT:
This chart analysis is only for reference purpose.
This is not buying or selling recommendations.
I am not SEBI registered.
Please consult your financial advisor before taking any trade

PRIVISCL- LONG FOR 40 %on weekly charts ,
price crossing weekly level
price bouncing from 18 week EMA
EMA fan getting established
MACD positive crossover

LongStock given Bo at 1353 then went upto 1717 then took support near 1437 made a consolidation range there and formed a traingle pattern making base line then given Breakout at 1508 and stock is at 1609 which is a good weekly closing expecting more bullish above 1717

PRIVISCL | Looks good for a 40-50% movePRIVISCL | Looks good for a 40-50% move
CMP : 1435
SL : 1200
Target : 2100

PRIVI SPECIALITY CHEMICALS - Rounding bottom with fresh volumesRounding bottom with fresh volumes.
Targets(T1, T2 & T3) mentioned along with expected time frames. Stop loss marked as SL. Can achieve better targets, should carry trailing stop loss once in good gains.
Also keep tracking quarterly results to monitor performance.
