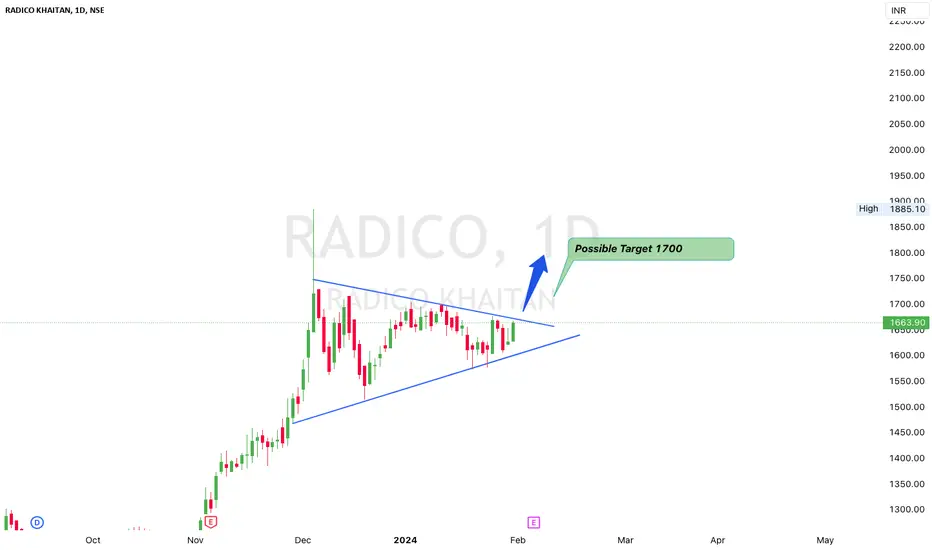
RADICO bullish; above 1690 ? - Monday 5th Feb.The above information does not constitute investment/trading recommendation and it is purely for educational purpose. Please check the Strategy below...
SWING Trading Strategy:
Position is created, only upon stock closing above the entry price on day closing basis and is held on for 5-10 trading sessions for larger gains (5-10%)
INTRADAY Trading Strategy:
1) Impulse upmove stage: The strong upmove (nearly upto 2% from breakoutprice) happens within five to 15 minutes. "High Risk Traders" buy in hope of another 2% upmove intraday.
"High Risk Traders" patiently wait through the Pullback-Consolidation stage to realize profits. High risk/High reward set up as breakouts may fakeout (reversal)also
2) Pullback-Consolidation stage: After the above "Impulse upmove stage"; the price may then pull back and move sideways (between "Open" price and "High" of the above "Impulse upmove stage").
Safe traders with minimum risk profile wait for a breakout from the consolidation to enter at this stage to relize high profits in the final intraday final "Breakout continuation" stage
3) Breakout continuation: Stocks often in the third stage breaks up above the "High" of the first "Impulse upmove stage" and continue to go higher again.
Both Safe Traders/High Risk Traders book profits at this stage
This do not constitute, financial, investment, trading, or other types of advice or recommendation.
RADICO trade ideas

RADICO BUYRadico is ready to reach 1700, seems bullish. good consolidation happened and seeing an pattern
#Radico khaitan | #symmetrical triangleRadico Khaitan after breaking symmetrical triangle doing retracement. Sustaining above 1130 will likely to open higher levels

Radico Khaitan-- Positive ClosingRadico Khaitan-- Positive Closing
1) Channel Trading
2) May break the channel and form new trend on either side, Prefered UPSIDE

#RADICO #NSE - SWING TRADE IDEARADICO KHAITAN.
Breakout from a CUP pattern in a weekly timeframe.
Radico Khaitan Ltd.'s Revenue was higher than average estimate 2 times in past 3 years.
EPS is expected to grow by 42.6% in FY24.
Trade Idea
For educational purpose only.
Not a Buy/Sell recommendation.
Plan your own entries, exits and
risk management.

RADICO BO [Weekly]RADICO had a long weekly base BO a few weeks back and now its giving a follow up BO on a smaller weekly base. Past 2 quarters have been good for the firm in terms of EPS growth.
Good Volumes as of now, looks like will give more movement ahead.
Keep an eye out for it.

Amazing breakout on Weekly / Daily Timeframe - RADICOCheckout an amazing breakout happened in the stock in Weekly timeframe, macroscopically seen in Daily timeframe. Having a great favour that the stock might be bullish expecting a staggering returns of minimum 25% TGT. IMPORTANT BREAKOUT LEVELS ARE ALWAYS RESPEECTED!
NOTE for learners: Place the breakout levels as per the chart shared and track it yourself to get amazed!!
#No complicated chart patterns
#No big big indicators
#No Excel sheet or number magics
TRADE IDEA: WAIT FOR THE STOCK TO BREAKOUT IN LOWER TIMEFRAME AND RETRACE IF NEEDED. SL IS NEARER SUPPORT ZONE IN 1HR TIMEFRAME.

radico weekly repeating uptrend moveradico again going up like past 3 time consolidation and up and this 4 th time weekly closing sane trend immediate level done near ath resistance crossing and sustain will further am i right share ur views
so may be accumulation butmonthly daily macd ok weekly little dn

RSI DIVERGENCE - RADICO KHAITANNSE:RADICO - DAILY CHART ANALYSIS
The price was heading down, making lower lows.
Initially, the RSI indicator was following the price too.
on daily chart its seen that the RSI starts making higher lows while the price is still heading down.
That’s when divergence pattern appears.
After a bullish divergence, the price will tend to change from a downtrend to an uptrend.
PLEASE NOTE THAT:
This chart analysis is only for reference purpose.
This is not buying or selling recommendations.
I am not SEBI registered.
Please consult your financial advisor before taking any trade.

RADICO KHAITAN INVERSE H&S BREAKOUTRadico khaitan breaking inverse h&s pattern
with good volume and rsi
trading above 20 ema
looking good 1470 #target
educational idea only

radico khaitan -- bullish 16.10.2023Radico Khaitan Ltd. is an interesting chart with following factors
1. ABCD Pattern on weekly chart
2. Harmonic pattern on daily chart
3. Stock trading near upper Bollinger band on daily charts
4. Narrowing Bollinger bands
5. Major Support zone 1190-1160
6. Minor resistance 20 Week SMA at 1266
Disclaimer: I am not an expert I just share interesting charts here for educational purpose and not to be taken as buy/sell recommendation. Please seek expert opinion before investing and trading as trading/ investing in market is subject to market risks. I do not hold any position in the stock as on date but I may look to buy on dips with my own Risk Reward matrix.

📈 Exciting Bullish Pattern Alert! 🐂📈 Exciting Bullish Pattern Alert! 🐂
📊 Pattern: Falling Channel
📌 Symbol/Asset: RADICO
🔍 Description: Stock is in a falling channel after downside, which is a bullish sign. Stock is making Broadning pattern also. We might see huge upside after a breakout of small resistance
👉 Disclosure: We are not SEBI registered analysts, this is not a buy or sell recommendation. Technical patterns are just one piece of the puzzle. Consider conducting further research, consulting with a financial advisor, and managing your risks appropriately.

RADICO KHAITAN LONG TRENDLINE SUPPORTCMP 1240
may bounce back from here
for educational purpose only
sl can be kept near 1150 depemding on move

RADICO - Weekly Chart AnalysisStock worth to keep in watchlist.
Stock sustaining for 3 weeks now above the ATH levels. NR3 formation. It broke out of the resistance and you can see volume contraction while the base was been formed and it broke out with good volumes. On daily its sitting on IV Support and a possible retest of the resistance (which shall now act as support) we can assume is been done too.
Stock trading above all key MA's.
Disclaimer: This is just an analysis and not a buy/sell recommendation. If you intend to trade this counter than do you own due diligence and trade at you own risk.

RADICO ANALYSISBullish view on Radico.
Price pulled back to breakout level and at inclined upward trendline.
Stoploss below support zone and target to swing high.

RADICO - Weekly AnalysisIn the Weekly Chart of RADICO ,
we can see that, it has retested the Trendline of Cup & handle breakout pattern.
We might also wee W pattern breakout if it moves in upward direction.
Expected momentum is shown in chart.

Investment Pick - BUY RADICOBuy Radico 1205-1200 sl 1170 trg 1700+
BO retest on weekly chart
RSI bullish divergence on weekly chart (Reversal confirmation is pending)

📈 Exciting Bullish Pattern Alert! 🐂📊 Pattern: Rising Wedge
📌 Symbol/Asset: Radico Khaitan
🔍 Description: Stock looks perfect buy near support, stop loss at 1100
👉 Remember: Technical patterns are just one piece of the puzzle. Consider conducting further research, consulting with a financial advisor, and managing your risks appropriately.


RADICOKeep a watch on this stock as it's bouncing from the demand zone. A stock that has good Risk reward ratio.

RADICO KHAITAN keep on radarRadico khaitan in profit booking zone if volume will reduce it will fall and good opportunity for buy once reach at bullish PR zone

Strong start in radicoRadico can be bought now with a stop below today's low.
Entry - 1372
SL - 1335
First target - 1440, then can be trailed

Weekly BreakoutIn Weekly chart - after closing below 50SMA, a clear All time high breakout with volumes in an already all time high stock
