Ramco Cements Ltd . Daily Chart Horizontal Channel1.There is consolidation in the horizontal channel between the 980 support and 1,098 resistance (white lines). A breakout above 1,098 would confirm the bullish reversal.
2. EMA status:
EMA 21 (purple) is above EMA 55 (green), showing short‑term bullish momentum.
EMA 55 is above EMA 100 (blue) and EMA 200 (orange), indicating the medium‑term trend is up.
Price is currently above all EMAs, providing multi‑timeframe support.
3. Volume: Volume has risen on the recent upmove, signaling growing buyer interest. A breakout should be accompanied by a spike above average volume for confirmation.
4. The View : Breakout looks possible but support of volume is needed a long with momentum - RSI is well above 60. This suggest fresh momentum
Ramco Cements Limited
No trades
What traders are saying

RAMCOCEMRAMCOCEM
bullish trend is Showing on the chart.
buy signals in
technical indicators and
Ascending Channel chart pattern.
BUYING RANGE 1060/1065
Watch for a retest 1060/1065 to sustain the bullish trend. If the resistance holds, there could be a retest towards 940/950 and an uptrend from here.
RAMCOCEM 1 Week Time Frame📌 Current Price (Approx)
~₹1,060 per share (latest trading range) — stock has been trading around this level recently.
📉 1-Week Key Levels (Support & Resistance)
🔹 Support Levels
Support 1: ~₹1,050 — short-term support zone.
Support 2: ~₹1,040–₹1,042 — secondary support.
Support 3: ~₹1,032–₹1,035 — deeper weekly support.
👉 If price closes below ₹1,040 on weekly basis, it may signal short-term weakness.
🔺 Resistance Levels
Resistance 1: ~₹1,068–₹1,070 — first near-term hurdle.
Resistance 2: ~₹1,077–₹1,078 — higher weekly resistance.
Resistance 3: ~₹1,087–₹1,093 — extended resistance zone.
👉 Break above ₹1,070–₹1,078 could open room toward ~₹1,087–₹1,093+ levels this week.
📊 Weekly Price Action Summary
Price has been trading near ~₹1,060 range, making this region a pivotal short-term level.
Short-term oscillators and technical ratings are mixed/neutral to mild buy.
Bullish bias this week if price stays above ₹1,050–₹1,055 and takes out ₹1,070+.
Bearish tilt if price closes below ₹1,040–₹1,050 on a weekly chart.
📍 Summary: 1-Week Levels
Level Type Price Zone
Major Support ₹1,050
Next Support ₹1,040–₹1,042
Lower Support ₹1,032–₹1,035
First Resistance ₹1,068–₹1,070
Higher Resistance ₹1,077–₹1,078
Extended Resistance ₹1,087–₹1,093+

Bullish vieew in RAMCOCEMRAMCOCEM looks bullish above 1070. The stock may give a good up move, after numerous weeks of consolidation if it sustains above this level with a stop loss of 975.

RAMCOCEM 1 Day Time Frame 📌 Current Price (Approx)
₹1007–₹1011 range on NSE during today’s session. Live market shows price around this zone (previous close ~₹1,011).
📊 Daily Pivot & Support/Resistance Levels (Updated)
(from reliable intraday pivot data)
Daily Pivot Zone
Central Pivot Point (CPR): ~₹1,011.4–₹1,011.8 (key equilibrium level)
Resistance Levels
R1: ~ ₹1,019
R2: ~ ₹1,027
R3: ~ ₹1,034–₹1,035
(above these levels can imply stronger upside if sustained)
Support Levels
S1: ~ ₹1,011–₹1,003
S2: ~ ₹996–₹992
S3: ~ ₹988–₹980
(broken support zones may accelerate downside)
✅ Key ODI pivots (Standard daily):
S1 ~ ₹1003.7
Pivot ~ ₹1019.1
R1 ~ ₹1027.3 (minor breakout level)
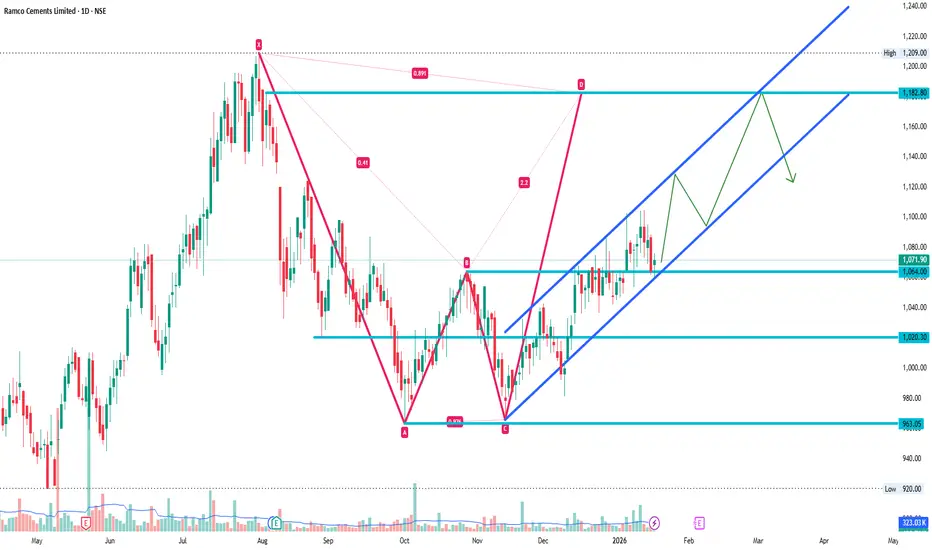
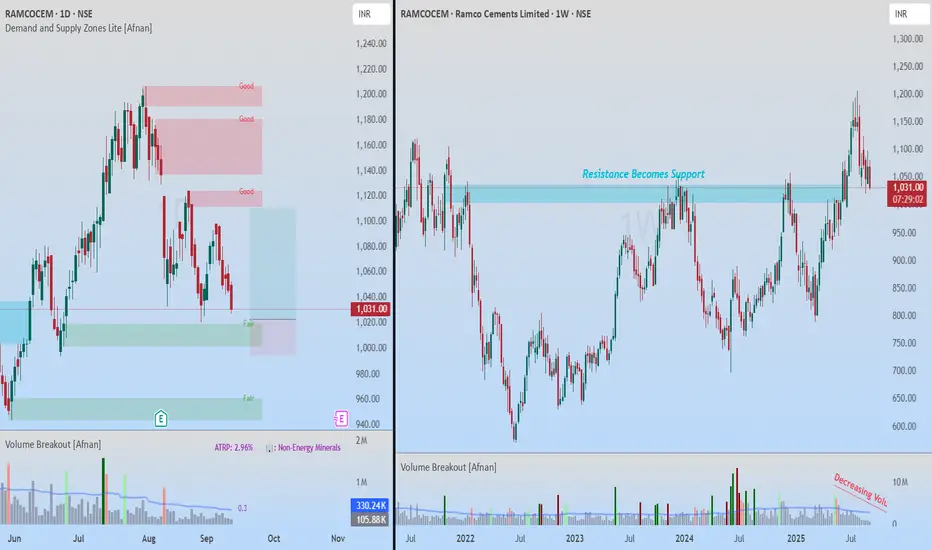
Dual Lens Analysis: Demand & Supply Meets Breakout Retest📊 Supply & Demand View 📊
Supply and demand zones are essentially institutional footprints . Large players never execute their full orders at once; instead, they build positions in chunks. This behavior leaves behind visible imbalances on the chart. Whenever price revisits these zones, strong reactions are often seen.
On the daily chart of Ramco Cements , price has reacted multiple times near a demand zone without fully testing it. Each time, we witnessed a bounce — a sign of heavy buying interest.
Now, the stock is once again approaching this zone for the third time, which statistically makes it a strong area to monitor. The weekly chart structure also shows higher highs and higher lows, signaling that the broader trend is bullish. With no immediate higher timeframe supply overhead, the setup offers a 1:3 favorable risk-to-reward scenario.
🚀 Breakout Retest View 🚀
On the weekly chart , Ramco Cements displays a textbook breakout retest. After years of respecting a major resistance level, price finally broke out, created fresh all-time highs, and is now pulling back to retest that very level.
This aligns perfectly with the principle of polarity: old resistance often flips into strong support.
Volume adds further conviction. Post-breakout, volume has been drying up during the pullback — an indication that sellers lack conviction.
✨ Final Takeaway ✨
Both perspectives — demand zone strength and breakout retest confirmation — are aligning bullishly. This confluence strengthens the case for Ramco Cements to resume its upward journey.
💡 Risk Management Reminder 💡
While the setup looks strong, risk management remains key. Always use SL and size positions carefully. Even the best setups can fail, but disciplined risk control ensures long-term success.
“In trading, patience and discipline are often the real edge.”
🔄 Stay disciplined, stay consistent — the market rewards those who wait! 🔄
This analysis is purely for educational purposes and is not intended as a trading or investment recommendation. I am not a SEBI registered analyst.
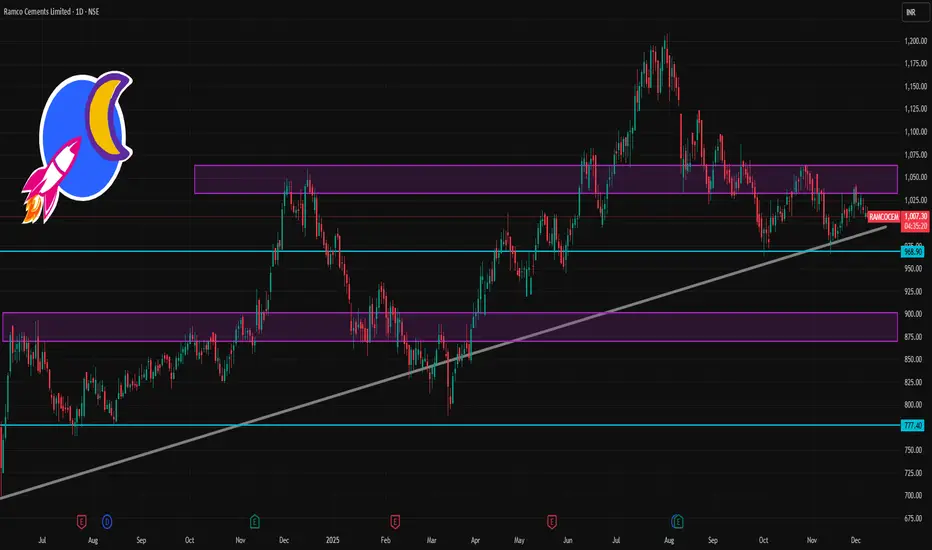
A Good Bullish IdeaBroken a multi-year trendline, came for re-test and roaming at new support(near the trendline). watch volume on long candles.
good to go long in it.
Kindly do your own analysis and dive into trading.
***Only for educational purposes***
Ramco Cements: Higher Highs Journey Reaches New PeakTechnical Analysis
Ramco Cements has demonstrated an exceptional long-term uptrend since 2006, continuously making higher highs and higher lows. The stock showcased remarkable growth from ₹50-60 levels to ₹1,100 by July 2021, representing an extraordinary 18-20x growth over 15 years.
Post the 2021 peak, the stock corrected to ₹600 levels but maintained its structural uptrend by forming higher lows. Following this pattern, it steadily climbed back to ₹1,100 levels, respecting the higher low formation.
The breakthrough moment came with expectations of positive Q1 FY26 results. The stock decisively broke its previous all-time high and surged to ₹1,200. Despite achieving positive outcomes in the results, some profit booking has occurred, bringing the stock to current levels of ₹1,050.
Entry Strategy: Enter on any dips with focus on continuation of the higher highs pattern.
Targets:
Target 1: ₹1,200
Target 2: ₹1,300
Target 3: ₹1,400
Stop Losses:
Major Support: ₹800 (higher low support zone)
If ₹800 level is taken down, no more expectations on this stock as it would break the higher low pattern.
Q1 FY26 Financial Highlights (vs Q4 FY25 & Q1 FY25)
Total Income: ₹2,074 Cr (↓ -13% QoQ from ₹2,397 Cr; ↓ -1% YoY from ₹2,094 Cr)
Total Expenses: ₹1,676 Cr (↓ -19% QoQ from ₹2,078 Cr; ↓ -5% YoY from ₹1,773 Cr)
Operating Profit: ₹398 Cr (↑ +25% QoQ from ₹319 Cr; ↑ +24% YoY from ₹320 Cr)
Profit Before Tax: ₹115 Cr (↑ +150% QoQ from ₹46 Cr; ↑ +140% YoY from ₹48 Cr)
Profit After Tax: ₹85 Cr (↑ +227% QoQ from ₹26 Cr; ↑ +130% YoY from ₹37 Cr)
Diluted EPS: ₹3.60 (↑ +210% QoQ from ₹1.16; ↑ +129% YoY from ₹1.57)
Fundamental Highlights
Ramco Cements delivered remarkable Q1 FY26 turnaround with consolidated PAT surging 227% QoQ and 130% YoY to ₹85 crore, driven by significant cost optimization and operational efficiency improvements. The company achieved this despite marginal revenue decline.
Market cap stands at ₹25,673 crore (up 34.2% in 1 year) with stable promoter holding at 42.6%. Stock demonstrated impressive 52.33% increase over the past year against Sensex's 2.15%, showcasing strong outperformance.
The company recently unveiled 'Hard Worker' construction chemicals brand with FY25 division revenue of ₹210 crore, targeting ambitious ₹2,000 crore in 4-5 years. This strategic diversification opens new growth avenues beyond traditional cement business.
Stock reached all-time high of ₹1,206.60 before current consolidation, with technical analysis showing strong institutional buying support. The breakout was accompanied by above-average volumes, adding conviction to the upward move.
Despite recent profit booking post-results, the stock maintains strong uptrend structure with 52-week high at ₹1,206.60 and current trading around ₹1,063, indicating healthy correction within the bull trend.
Conclusion
Ramco Cements' exceptional 227% QoQ PAT recovery and 18-year higher highs pattern reaching new ₹1,200 peak validates the long-term uptrend thesis. The construction chemicals diversification targeting ₹2,000 crore revenue and strong institutional support provide additional growth catalysts. Current consolidation near ₹1,063 offers attractive entry for targeting ₹1,400 levels. Critical support at ₹800 must hold to maintain higher low pattern integrity.
Disclaimer: lnkd.in

Ramco Cements: Higher Highs Journey Reaches New Peak🔍 Technical Analysis
Ramco Cements has demonstrated an exceptional long-term uptrend since 2006, continuously making higher highs and higher lows. The stock showcased remarkable growth from ₹50-60 levels to ₹1,100 by July 2021, representing an extraordinary 18-20x growth over 15 years.
Post the 2021 peak, the stock corrected to ₹600 levels but maintained its structural uptrend by forming higher lows. Following this pattern, it steadily climbed back to ₹1,100 levels, respecting the higher low formation.
The breakthrough moment came with expectations of positive Q1 FY26 results. The stock decisively broke its previous all-time high and surged to ₹1,200. Despite achieving positive outcomes in the results, some profit booking has occurred, bringing the stock to current levels of ₹1,050.
Entry Strategy: Enter on any dips with focus on continuation of the higher highs pattern.
🎯 Targets:
Target 1: ₹1,200
Target 2: ₹1,300
Target 3: ₹1,400
🚫 Stop Losses:
Major Support: ₹800 (higher low support zone)
If ₹800 level is taken down, no more expectations on this stock as it would break the higher low pattern.
💰 Q1 FY26 Financial Highlights (vs Q4 FY25 & Q1 FY25)
Total Income: ₹2,074 Cr (↓ -13% QoQ from ₹2,397 Cr; ↓ -1% YoY from ₹2,094 Cr)
Total Expenses: ₹1,676 Cr (↓ -19% QoQ from ₹2,078 Cr; ↓ -5% YoY from ₹1,773 Cr)
Operating Profit: ₹398 Cr (↑ +25% QoQ from ₹319 Cr; ↑ +24% YoY from ₹320 Cr)
Profit Before Tax: ₹115 Cr (↑ +150% QoQ from ₹46 Cr; ↑ +140% YoY from ₹48 Cr)
Profit After Tax: ₹85 Cr (↑ +227% QoQ from ₹26 Cr; ↑ +130% YoY from ₹37 Cr)
Diluted EPS: ₹3.60 (↑ +210% QoQ from ₹1.16; ↑ +129% YoY from ₹1.57)
🧠 Fundamental Highlights
Ramco Cements delivered remarkable Q1 FY26 turnaround with consolidated PAT surging 227% QoQ and 130% YoY to ₹85 crore, driven by significant cost optimization and operational efficiency improvements. The company achieved this despite marginal revenue decline.
Market cap stands at ₹25,673 crore (up 34.2% in 1 year) with stable promoter holding at 42.6%. Stock demonstrated impressive 52.33% increase over the past year against Sensex's 2.15%, showcasing strong outperformance.
The company recently unveiled 'Hard Worker' construction chemicals brand with FY25 division revenue of ₹210 crore, targeting ambitious ₹2,000 crore in 4-5 years. This strategic diversification opens new growth avenues beyond traditional cement business.
Stock reached all-time high of ₹1,206.60 before current consolidation, with technical analysis showing strong institutional buying support. The breakout was accompanied by above-average volumes, adding conviction to the upward move.
Despite recent profit booking post-results, the stock maintains strong uptrend structure with 52-week high at ₹1,206.60 and current trading around ₹1,063, indicating healthy correction within the bull trend.
✅ Conclusion
Ramco Cements' exceptional 227% QoQ PAT recovery and 18-year higher highs pattern reaching new ₹1,200 peak validates the long-term uptrend thesis. The construction chemicals diversification targeting ₹2,000 crore revenue and strong institutional support provide additional growth catalysts. Current consolidation near ₹1,063 offers attractive entry for targeting ₹1,400 levels. Critical support at ₹800 must hold to maintain higher low pattern integrity.

Ramco Cement TGT 1374For Ramco Cements, ₹1099 is a strong support level. If the price sustains above this level, the next resistance is around ₹1375.

Ramco Cement Break Out Strong Is This the Start of a New Rally?📉Technical View:
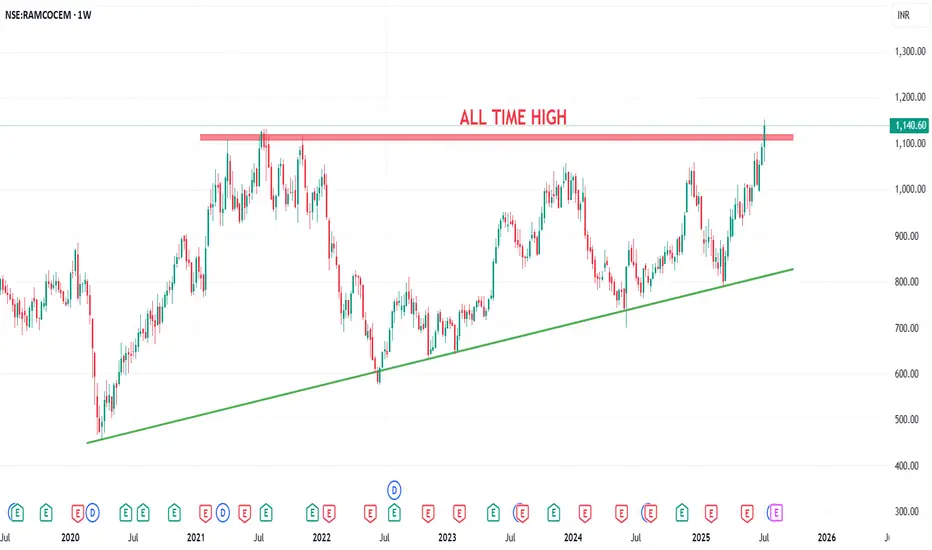
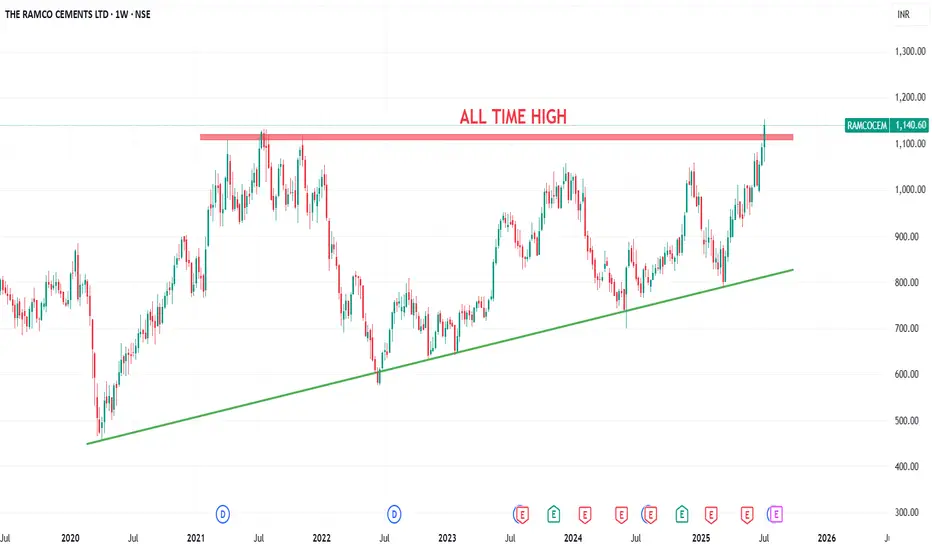
Ramco Cement Limited has formed a beautiful ascending triangle pattern with a strong resistance zone at ₹1080–₹1130, tested since 2021. Today, it broke out and hit a new all-time high of ₹1152, now hovering around ₹1140.
If the breakout holds, we may see:
🎯Target 1: ₹1200
🎯Target 2: ₹1240
🎯Target 3: ₹1300
If the stock falls back below ₹1030, the breakout becomes invalid.
💰Q4 FY24 Financial Highlights (vs Q3 FY24 & Q4 FY23)
Total Income: ₹2397 Cr (↑+21% vs ₹1983 Cr; ↓–10% vs ₹2678 Cr)
Total Expenses: ₹2078 Cr (↑+93% vs ₹1074 Cr; ↓–8% vs ₹2259 Cr)
Operating Profits: ₹319 Cr (↑+14% vs ₹279 Cr; ↓–24% vs ₹419 Cr)
Profit Before Tax: ₹46 Cr (↓–76% vs ₹191 Cr; ↓–74% vs ₹175 Cr)
Profit After Tax: ₹26 Cr (↓–86% vs ₹182 Cr; ↓–80% vs ₹129 Cr)
Diluted EPS: ₹1.16 (↓–85% vs ₹7.72; ↓–79% vs ₹5.46)
🧾Despite strong revenue growth and higher operating profits sequentially, sharp cost escalations impacted margins in Q4.
📈Fundamentals & Dividend Insights:
✅ Company continues with capacity expansion in East & South India.
✅ Focus on green energy & cost optimization to improve margin outlook.
💸 Dividend Declared (May 2025): ₹3.50 per share
📝Conclusion:
The breakout on charts is significant and supported by top-line improvement. If sustained, the stock may offer strong upside potential, making Ramco Cement one to watch closely.
Disclaimer: lnkd.in
Ramco Cement Break Out Strong Is This the Start of a New Rally ?📉 Technical View:
Ramco Cement Limited has formed a beautiful ascending triangle pattern with a strong resistance zone at ₹1080–₹1130, tested since 2021. Today, it broke out and hit a new all-time high of ₹1152, now hovering around ₹1140.
If the breakout holds, we may see:
🎯 Target 1: ₹1200
🎯 Target 2: ₹1240
🎯 Target 3: ₹1300
If the stock falls back below ₹1030, the breakout becomes invalid.
💰 Q4 FY24 Financial Highlights (vs Q3 FY24 & Q4 FY23)
Total Income: ₹2397 Cr (↑+21% vs ₹1983 Cr; ↓–10% vs ₹2678 Cr)
Total Expenses: ₹2078 Cr (↑+93% vs ₹1074 Cr; ↓–8% vs ₹2259 Cr)
Operating Profits: ₹319 Cr (↑+14% vs ₹279 Cr; ↓–24% vs ₹419 Cr)
Profit Before Tax: ₹46 Cr (↓–76% vs ₹191 Cr; ↓–74% vs ₹175 Cr)
Profit After Tax: ₹26 Cr (↓–86% vs ₹182 Cr; ↓–80% vs ₹129 Cr)
Diluted EPS: ₹1.16 (↓–85% vs ₹7.72; ↓–79% vs ₹5.46)
🧾Despite strong revenue growth and higher operating profits sequentially, sharp cost escalations impacted margins in Q4.
📈 Fundamentals & Dividend Insights:
✅ Company continues with capacity expansion in East & South India.
✅ Focus on green energy & cost optimization to improve margin outlook.
💸 Dividend Declared (May 2025): ₹3.50 per share
📝 Final Word:
The breakout on charts is significant and supported by top-line improvement. If sustained, the stock may offer strong upside potential, making Ramco Cement one to watch closely.
Ramco Cement may give break out of triangle pattern soon.Ramco Cement as per chart is trading on triangle pattern. As per indicator stock is bullish and ready for breakout. Major supply zone is 1010. After crossing this level, it may give massive move for considerable gain. It can accumulate here add more after breakout.
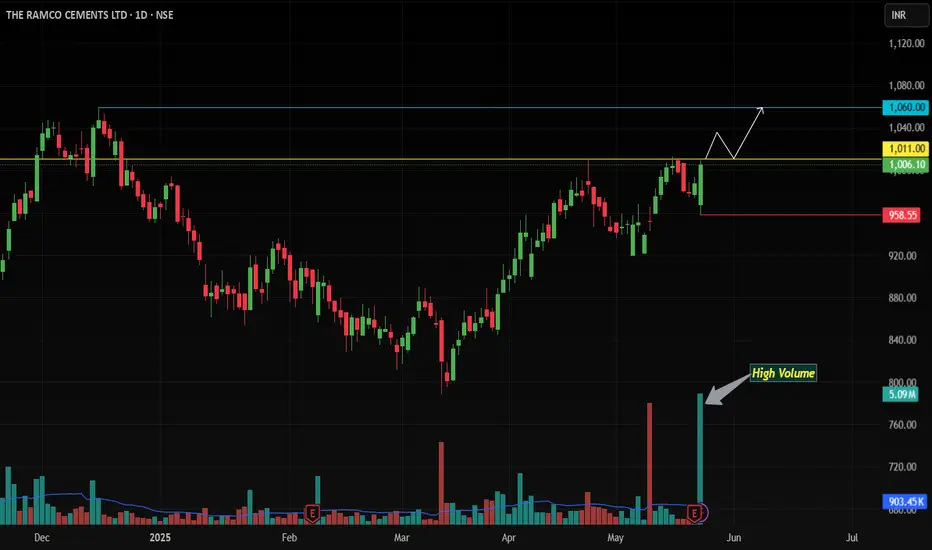
Bullish Breakout Alert! Key Resistance Zone Tested !Analysis Timeframe: Daily Chart | Instrument: The Ramco Cements Ltd (NSE: RAMCOCEM, BSE: RAMCOCEM)
Current Price: Near 1011-1015 | Key Levels: Resistance Zone (1011-1015), Support: 958 (Trailing SL)
🔍 Technical Setup Overview
Ramco Cements (NSE: RAMCOCEM) is flashing a high-conviction bullish reversal pattern on the daily chart, backed by surge in volume and multi-indicator confirmations:
Bullish Engulfing Candle 🕯️🔥
Today’s price action formed a Bullish Engulfing pattern, with the current candle fully swallowing the prior candle. This signals a strong shift in control from sellers to buyers, especially on extremely high volume (institutional accumulation).
EMA Alignment & Dynamic Support
Price rebounded sharply from the 20 EMA and sustains above the 50 EMA and 200 EMA, confirming the broader uptrend’s strength.
Resistance Breakout Potential
The 1011-1015 zone is a critical supply area. A daily close above 1015 would confirm the breakout, opening the path for a rally.
Momentum Confirmation
MACD: Bullish crossover
RSI: Crossed above, signaling bullish momentum acceleration.
🎯 Trade Strategy
Entry Trigger:
Go Long on Daily Close Above 1015
Targets:
First Target: 1060.
Trailing SL Strategy: After 1060, trail SL to the prior daily candle’s low. Exit only on a daily close below the trailing level.
Risk Management:
Initial Stop Loss: 958 (Today’s low, aligns with Bullish Engulfing pattern validity).
Risk-Reward Ratio: 1:2+ (Optimal for swing trades).
📉 Why This Works
Pattern Power: Bullish Engulfing + volume surge = high-probability reversal signal.
Trend Confirmation: Price above all key EMAs + breakout alignment.
Trailing SL: Locks profits while allowing for extended upside in a trending market.
🛡️ Key Risks
False Breakout: Failure to close above 1015 could trap bulls.
Market Sentiment Shift: Broader volatility may disrupt momentum.
Disclaimer: Trading involves risk. This is not financial advice. Verify setups independently.
#NSE #BSE #Breakout #BullishEngulfing #TechnicalAnalysis #RAMCOCEM #StockMarket
SMASH THAT BOOST BUTTON if you’re bullish! 🚀 Follow for more high-probability setups!
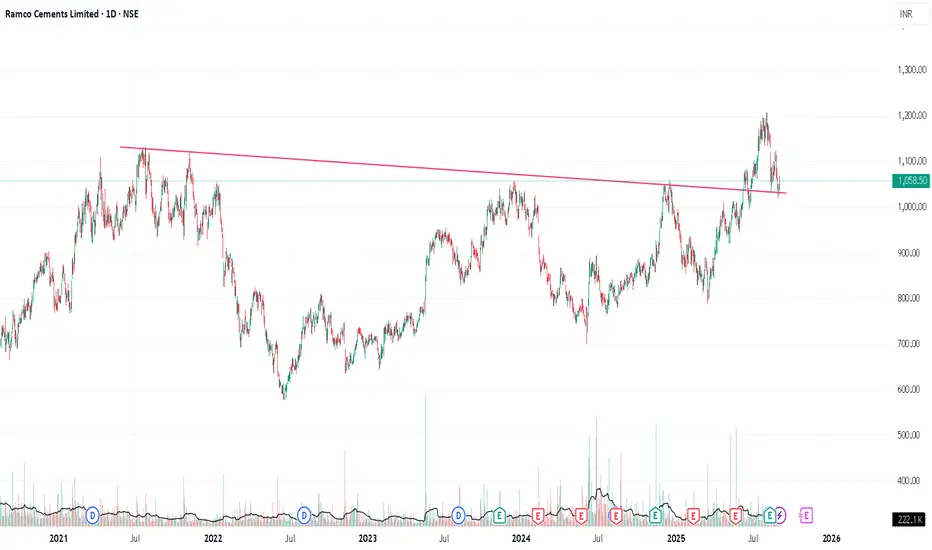
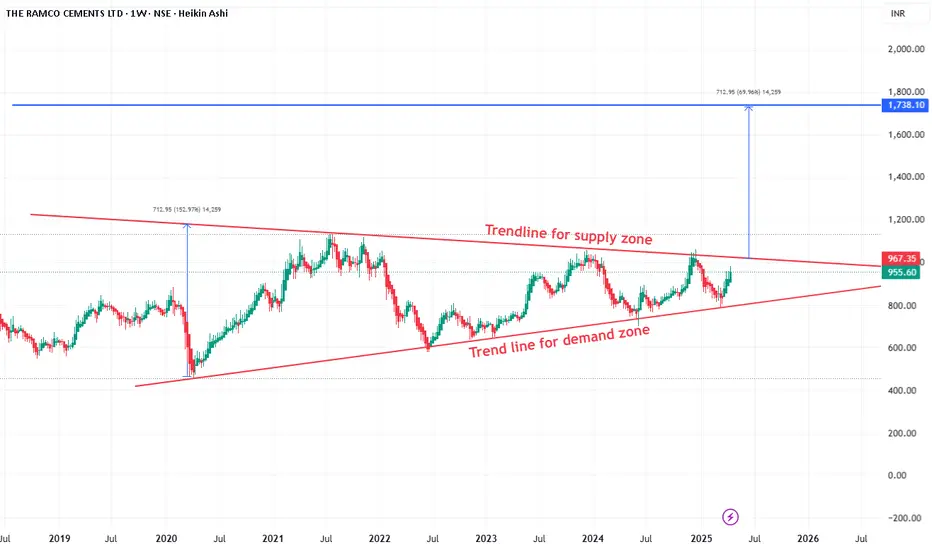
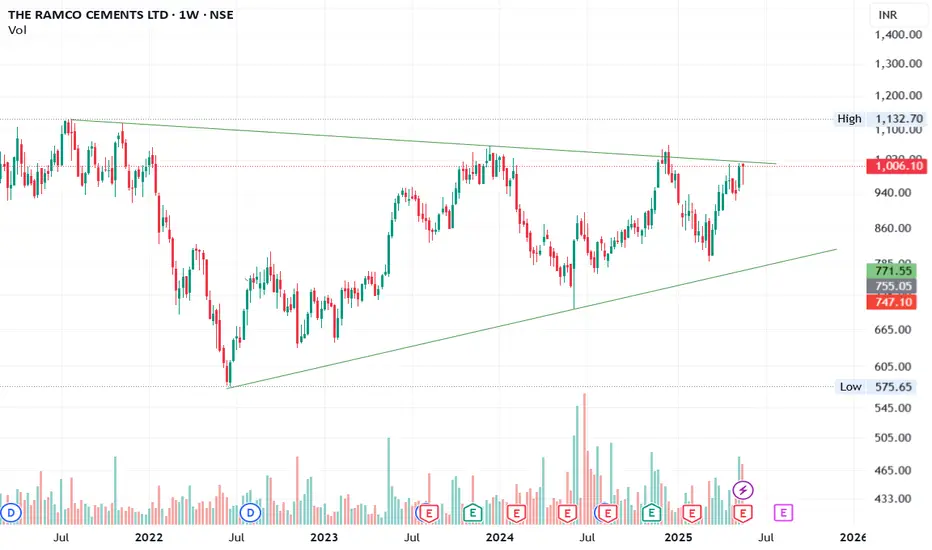
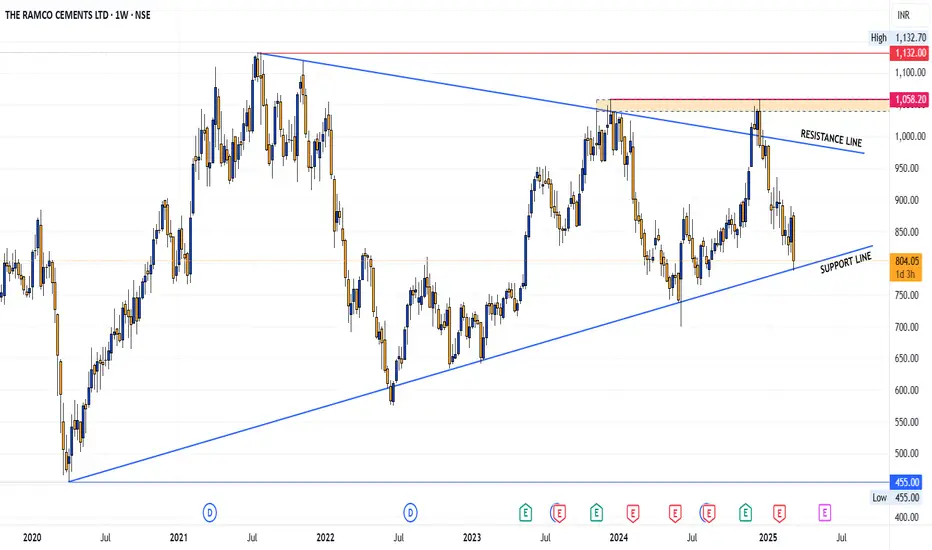
RAMCOCEM Weekly| Multi-Year Symmetrical Triangle Breakout?📌 Chart: Weekly | Symbol: NSE:RAMCOCEM
Ramco Cements is testing the upper resistance of a multi-year symmetrical triangle that has been forming since mid-2021. This type of consolidation often precedes a major breakout or breakdown, and we’re now at a critical decision point.
💡 Key Observations:
Price is coiling near the triangle apex — a breakout above ₹1,020 could lead to a strong momentum move.
Multiple attempts to break the upper trendline show building pressure.
Volume has started to pick up on green candles — early signs of accumulation?
Weekly RSI trending higher, signaling strength.
📈 Levels to Watch:
Breakout Zone: ₹1,010–₹1,020
Target Zones: ₹1,150 → ₹1,250+ (if breakout sustains)
Support: ₹930 (short-term), ₹870 (pattern base)
🧠 Bias: Bullish on breakout confirmation
⏳ Strategy: Wait for a close above ₹1,020 with volume. Keep SL below last swing low.
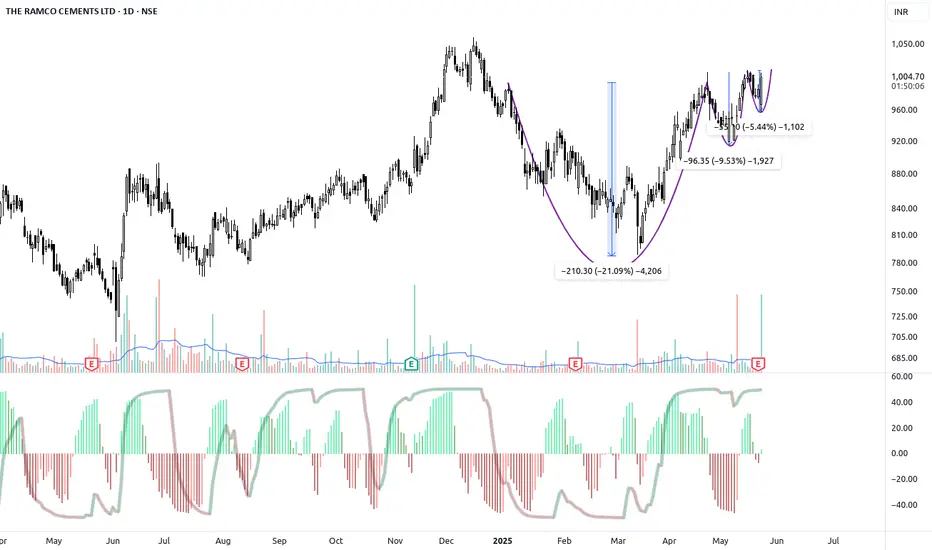
RAMCOCEM 📈 RAMCOCEM – Classic VCP Setup with Breakout Potential 🚀
🔍 Technical Structure: VCP (Volatility Contraction Pattern)
Ramco Cements is currently exhibiting a textbook Volatility Contraction Pattern (VCP) – a bullish continuation pattern popularized by Mark Minervini. This setup often precedes explosive breakouts, especially when accompanied by key technical confirmations.
✅ VCP Phases Observed:
Wave 1: Decline of ~21% (₹210) from swing high
Wave 2: Pullback of ~9.5% (₹96)
Wave 3: Most recent pullback ~5.4% (₹55)
Each contraction has been shallower and tighter — textbook VCP behavior.
The current base is tightening, and price is forming a mini-cup on the right side.
📊 Volume Action (Key to VCP)
Volume consistently drying up during each successive pullback — a sign of supply absorption.
Today’s session showed a spike in volume with a bullish candle, suggesting possible initiation of demand and interest at key resistance levels.
📈 Moving Averages Confirmation
Price is trading above all major moving averages:
🔹 20 EMA
🔹 50 EMA
🔹 100 SMA
🔹 200 SMA
All MAs are positively sloped, reinforcing a strong uptrend across short, medium, and long-term timeframes.
✅ Conclusion
Ramco Cements is forming a high-quality VCP setup supported by:
Strong volume contraction behavior,
Positive price action near breakout zone,
Clean structure above key MAs,
Bullish momentum and improving market sentiment.
📢 Keep this stock on high alert. A strong breakout above ₹1,020 could trigger a powerful upside rally.
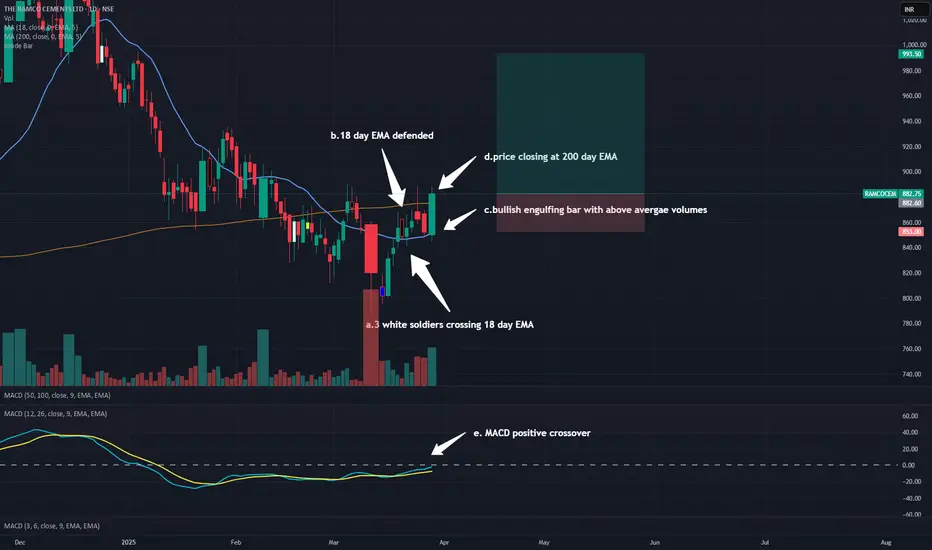
RAMCOCEM-long for 10 %Capital spending likley incraesing after the new government formation
expecting infra related stocks to rally with this quaterly results
technicals
1. price crossed above 18 day EMA and sustained
2. bullsih engulfing bar closing above 200 day EMA
target and SL marked
Ramco Industries Ltd1. Short Term (2025-2026): Cautiously Optimistic
Bullish Factors:
Strong GDP Growth (6.57%): India remains the fastest growing major economy.
Corporate Earnings Growth (12-15% CAGR): Driven by banking, consumer, and infrastructure sectors.
FII Inflows Returning: Global funds shifting back to EM equities, including India.
Election Stability (Post-2024): Policy continuity expected under Modi 3.0.
Bearish Risks:
High Valuations: Nifty 50 P/E ~22x (above 10year avg. of 20x).
Global Macro Risks: US Fed rate cuts delayed, geopolitical tensions (China, Middle East).
SectorSpecific Pressures: IT (slow growth), FMCG (rural demand lag).
Structural Bull Run Expected Mega trends Driving Growth: Manufacturing & PLI Boom: Electronics, pharma, and EVs benefiting from China+1. Digital & Financial Inclusion: UPI, fintech, and 5G adoption accelerating. Infrastructure Push: Roads, railways, renewable energy (500 GW by 2030) and WATER TREATMENT INFRASTRUCTURE.
The cement industry can be considered a good proxy for the overall health of the economy, particularly infrastructure investments and construction activity. Cement demand is directly linked to construction and infrastructure projects, which are key indicators of economic activity.The demand for cement rises, making the cement industry a good barometer for these investments
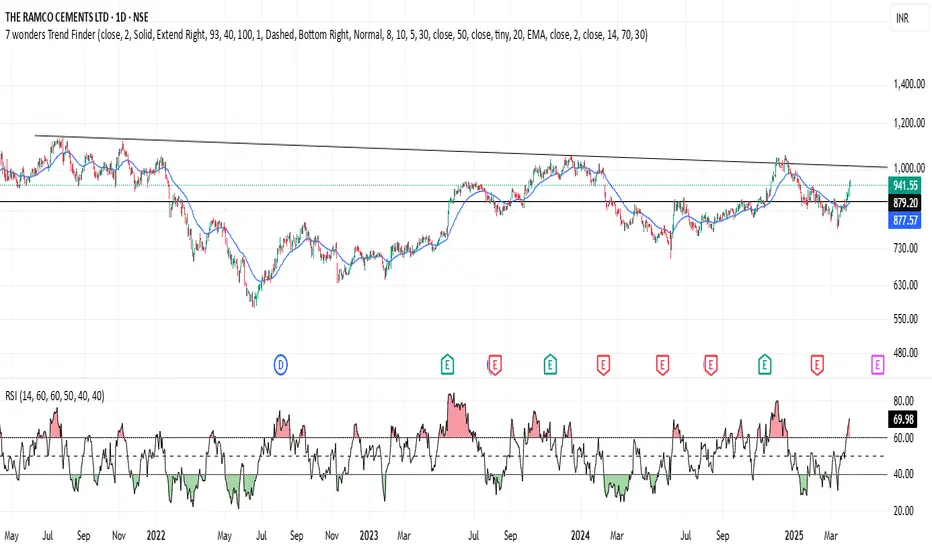
Ramco Cements: A triangle pattern is emergingRamco Cements is developing a triangle pattern, which occasionally offers support and resistance points that can create trading opportunities. I've highlighted these levels on the chart, and I hope this might be useful for anyone looking to navigate these price movements.
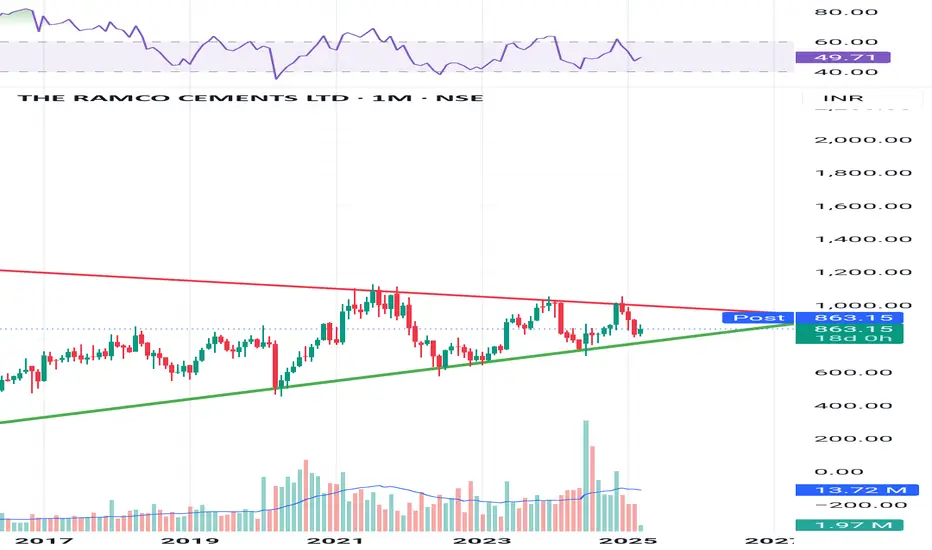
Ramco Cements at a Crossroad: Big Breakout or Breakdown Ahead?This chart shows The Ramco Cements Ltd on a monthly timeframe, with price action forming a clear structure.
Analysis:
Pattern: A symmetrical triangle pattern, where the price is trading within a narrowing range.
Resistance (Red Line): Around ₹1000, where the price has faced multiple rejections.
Support (Green Line): Higher lows, indicating that the long-term uptrend is still intact.
RSI: Currently around 49.71, sitting in a neutral zone — neither overbought nor oversold.
Deception Point:
If the price breaks below ₹800 and sustains, it could signal a bearish breakdown.
Conversely, a breakout above ₹1000 with volume confirmation could trigger a strong bullish rally.
Next Steps:
Wait for a breakout with volume to confirm the move.
Enter the trade only after a confirmation candle to avoid getting trapped in a false breakout.
The Ramco Cements Ltd.The chart of The Ramco Cements Ltd. displays a symmetrical triangle pattern, formed by converging trendlines of lower highs and higher lows, indicating a period of consolidation with decreasing price volatility. The upper boundary, acting as resistance, lies around INR 1,030–1,045, while the lower boundary, providing support, is near INR 800–850. This pattern suggests a potential breakout, where a move above INR 1,045 would signal bullish momentum, while a breakdown below INR 850 could indicate bearish pressure. The breakout target can be estimated by adding the triangle's height (the widest part of the pattern) to the breakout point. Traders should monitor for a decisive breakout or breakdown to determine the next price movement.

Ramco Cements Ltd view for Intraday 17th Dec #RAMCOCEM
Ramco Cements Ltd view for Intraday 17th Dec #RAMCOCEM
Resistance 1055-1060 Watching above 1283 for upside movement...
Support area 1040 Below 1060 ignoring upside momentum for intraday
Support 1040 Watching below 1035 or downside movement...
Resistance area 1055-1060
Above 1050 ignoring downside move for intraday
Charts for Educational purposes only.
Please follow strict stop loss and risk reward if you follow the level.
Thanks,

THE RAMCO CEMENETS - RAMCOCEMRAMCO CEMENTS share has broken out, with the first target set at the all-time high. I recommend placing the stop loss below 980.
