RAMCOSYSRAMCOSYS
Retesting it’s 26 Years Trendline Zone, technical indicators and
descending triangle chart pattern.
Ramco Systems Limited
No trades
What traders are saying

BUY TODAY SELL TOMORROW for 5%DON’T HAVE TIME TO MANAGE YOUR TRADES?
- Take BTST trades at 3:25 pm every day
- Try to exit by taking 4-7% profit of each trade
- SL can also be maintained as closing below the low of the breakout candle
Now, why do I prefer BTST over swing trades? The primary reason is that I have observed that 90% of the stocks give most of the movement in just 1-2 days and the rest of the time they either consolidate or fall
Cup & Handle Breakout in RAMCOSYS
BUY TODAY SELL TOMORROW for 5%

Ramco rallying but be cautious Ramco systems is rallying and close to breakout. But this breakout will be happening after 4 years. Possibility is that the stock may have lost its sheen by the time it gives breakout. A warning to retail investors to be cautious while in investing. Personally, I would have kept out.
Yes it has given positive quarterly results but that's not enough.
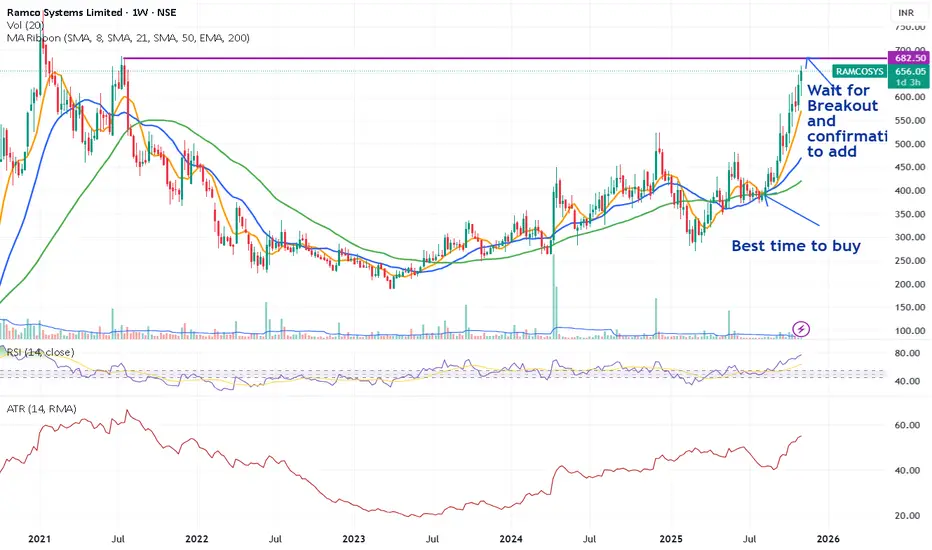
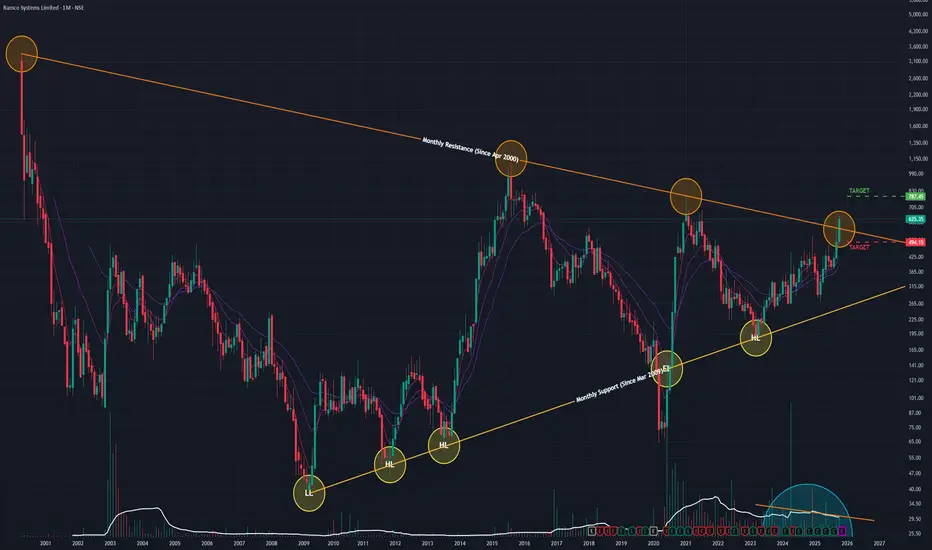
Ramco Systems (M): Extremely Bullish, Multi-Decade BreakoutThis stock is displaying one of the most powerful bullish technical signals possible: a decisive breakout from a 25-year angular resistance trendline . This is a major, long-term secular trend change.
📈 1. The Long-Term Context
- The 25-Year Pattern: Since its peak in April 2000, the stock has been held down by a massive, multi-decade angular resistance trendline.
- The Bottom & Reversal: The stock formed its ultimate bottom in March 2009. Since then, it has been in a slow, 16-year recovery, forming a pattern of Higher Lows against this unbreachable resistance.
- Volume Contraction: Volume was declining (or contracting) during the final phases of this consolidation. This is a classic sign of seller exhaustion right before a major breakout.
🚀 2. The Decisive Breakout
In October 2025, this 25-year pattern was shattered:
- The Surge: The stock surged +26.61% in a single month.
- High-Conviction Volume: This move was backed by a massive spike in volume ( 2.77 Million shares), confirming strong institutional interest and the validity of the breakout.
- The Close: Most importantly, the stock closed firmly above the 25-year trendline, signaling the "lid" has finally been broken.
📊 3. Key Technical Indicators
The underlying momentum supports this new long-term trend:
- RSI: The Relative Strength Index is rising, showing that strong buying momentum is accelerating.
- EMAs: The short-term Exponential Moving Averages are in a "PCO" (Price Crossover) state, confirming the new bullish trend is in effect across timeframes.
🎯 4. Future Scenarios & Key Levels to Watch
This breakout provides a very clear road map.
🐂 The Bullish Case (Confirmation)
- Confirmation: The "gold standard" for a breakout of this magnitude is a successful "re-test." We want to see the price pull back to the old trendline (now new support, around ₹560 ) and "bounce," confirming the breakout is genuine.
- Target: Once confirmed, the next logical technical price target is ₹787 .
🐻 The Bearish Case (Breakout Failure)
- Trigger: If the momentum is not sustained, and the breakout is a "fakeout" (a "bull trap").
- Confirmation: The stock fails to hold its gains and closes back below the broken trendline (around ₹560 support level) on high volume.
- Target: This failure would invalidate the immediate thesis and likely lead to a sharp sell-off.
BUY TODAY SELL TOMORROW for 5%DON’T HAVE TIME TO MANAGE YOUR TRADES?
- Take BTST trades at 3:25 pm every day
- Try to exit by taking 4-7% profit of each trade
- SL can also be maintained as closing below the low of the breakout candle
Now, why do I prefer BTST over swing trades? The primary reason is that I have observed that 90% of the stocks give most of the movement in just 1-2 days and the rest of the time they either consolidate or fall
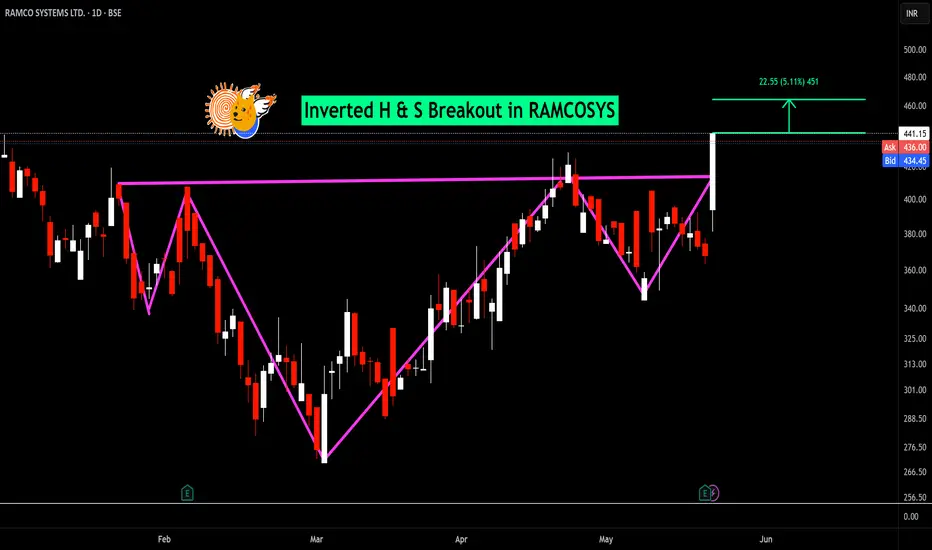
Inverted h & S Breakout in RAMCOSYS
BUY TODAY SELL TOMORROW for 5%
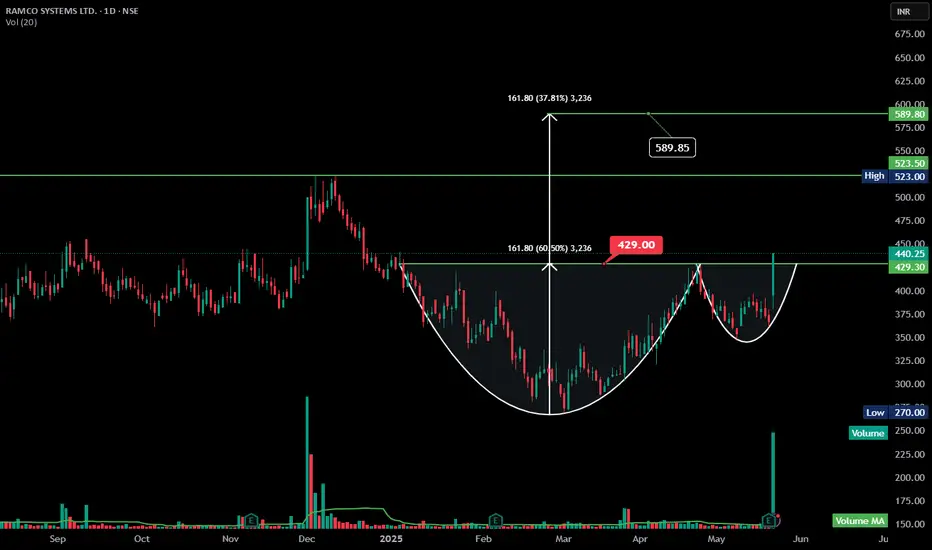
RAMCOSYS Bullish Cup and Handle Breakout | Daily**technical analysis** for the RAMCO SYSTEMS LTD chart:
---
### **Technical Analysis – RAMCO SYSTEMS LTD (NSE: RAMCOSYS)**
**Pattern:** Cup and Handle
**Breakout Level:** ₹429
**Current Price:** ₹440.25
**Volume Confirmation:** Strong volume on breakout day (1.82M), supporting validity of the breakout.
**Target Price:** ₹589.80 (based on height of cup added to breakout point)
**Percentage Upside from Breakout:** \~37.81%
**Support Levels:** ₹429 (previous resistance), ₹380 (handle base)
**Stop-Loss (if trading):** Below ₹400 for short-term traders
**Analysis Summary:**
Ramco Systems has broken out of a classic Cup and Handle pattern with strong bullish momentum and a nearly 20% single-day gain. The breakout is supported by significant volume, indicating strong buying interest. The projected target lies around ₹589 based on the pattern measurement. Traders should watch for sustained volume and price action above ₹429 for continuation.
---
Positional TradeRamco Systems
CMP 490
Buy on Dips till 410
SL CLB 375
Targets 700 & 890
Don't forget to Boost 🚀 this idea
For more info - Plz visit my profile & Follow for more
Rdgs,
Naresh G
Sebi Reg.RA

RAMCO SYSTEM SET FOR BIG RUNRamco system today gave ascending triangle breakout on weekly charts. Stock gave 52 week high closing with good volume. Expected to test 700 at least in medium term and break all time high in next 12 month.

Triangle Breakout + Retrace - RAMCOSYSRAMCOSYS has retraced after a breakout from the traingle pattern and is expected to move upward. CMP - 416.3 TARGET - 456 which is 11% from the current price.

70% Upside Possible In Ramco System Looking Very Strongresistance + Trendline breakout with very high volume
strong closing above all major resistance area
adx rising and macd crossover done with strong momentum
this will give decent return in coming months

RAMCOSYS...WEEKLY after yrs of consolidation , finall price coming out of ema contration.
major upside can be seen.

BUY TODAY SELL TOMORROW for 5%DON’T HAVE TIME TO MANAGE YOUR TRADES?
- Take BTST trades at 3:25 pm every day
- Try to exit by taking 4-7% profit of each trade
- SL can also be maintained as closing below the low of the breakout candle
Now, why do I prefer BTST over swing trades? The primary reason is that I have observed that 90% of the stocks give most of the movement in just 1-2 days and the rest of the time they either consolidate or fall.
Trendline Breakout in GPIL
BUY TODAY SELL TOMORROW for 5%

Ramcosys 30% move possible on upcoming months Triangle breakout
Weekly closing need above 380 to good move
Horizontal line breakout
Swing trade
Positional trade
Patience is imp
NSE:RAMCOSYS

Ramco SystemsEnter positionally @300 around. Add dips. stock seems ready for upside.
No SL from my side .
Disclaimer: --- this is my portfolio pick @310... taken 140 quantities.

Ramco- ApnaRamco- Apna
1) Respect Trendline
2) Seems Accumulation
3) Bullish Engulfing + VOlume
4 ) Bugger Timeframe trendline may break up

RAMCOSYS seems bullishRAMCOSYS has broken a year long Cup and Handle pattern and can give 10-15% return. Enjoy.
Note - I am not a Financial advisor just a predictor and it is just a prediction done by me. So trade carefully. Do your own research before putting YOUR money in market. Have a good trading day.

Remco SYSBook profits within the first 30 minutes of the market opening
- Try to exit by taking 10-15% profit of each trade
- SL can be taken when the 5/15 min candle closes below 44EMA
Now, why do I prefer swing trades? The primary reason is that I have observed that 90% of the stocks give most of the movement in just 3-4 days and the rest of the time they either consolidate or fall
CMP- 313
Target Price 360
Note:- I am not SEBI Registered This Trade is only educational Purpose

RAMCOSYS LOOKING GOOD FOR SWING TRADEAs per my analysis based on volume it is ready for upward ride.
BUY ABOVE 336 FOR TARGET OF 370 ,490 and 690.

RAMCOSYS --- seems upward journey started towards 600NSE:RAMCOSYS
seems upward journey started towards 600
gave nice breakout on weekly timeframe at 300 in july
was in small consolidation throughout august
and now in september it is back to resuming its upward journey
cmp is 313
This analysis is being done for educational and knowledge-sharing purposes.
This article does not offer any kind of buy or sell advice.
All stocks are positional and are held for a short to medium period of time.
Everyone is expected to conduct their own research and analysis to determine whether my point of view aligns with yours.

Ramco System Falling Wedge BreakoutRAMCOSYS- CMP 261
Weekly Chart
Falling Wedge Breakout
Support- 230
Resistance- 300/375/475/525

RAMCOSYS - Ichimoku Bullish Breakout Stock Name - Ramco Systems Limited
Ichimoku Cloud Setup :
1). Today's close is above the Conversion Line
2). Future Kumo is Turning Bullish
3). Chikou span is slanting upwards
All these parameters are showing bullishness at CMP
and more bullishness will be visible once it's cross 337.
#This is not Buy and Sell recommendation to any one. This is for education purpose and a helping hand to learn trading in Market.
# Cloud Trading
# Ichimoku Cloud
# Ichimoku Followers
I hope you all like my analysis.
Please do share your thoughts into comment section.
Please give a like, it motivates me to do analysis.

Buy Today, Sell Tomorrow: RAMCOSYSON'T HAVE TIME TO MANAGE YOUR TRADES?
- Take BTST trades at 3:25 pm every day
- Book profits within the first 30 minutes of the market opening
- Try to exit by taking 3-5% profit of each trade
- SL can be taken when the 5/15 min candle closes below 44EMA
- SL can also be maintained as 1% or closing below the low of the breakout candle
The levels mentioned on the chart are calculated using the BREAKOUT INDICATOR
Now, why do I prefer BTST over swing trades? The primary reason is that I have observed that 90% of the stocks give most of the movement in just 1-2 days and the rest of the time they either consolidate or fall
Trendline Breakout in RAMCOSYS
Buy Today, Sell Tomorrow: RAMCOSYS

Falling wedge patternThe stock is making a falling wedge pattern and good volumes lately. Tomorrow buy above 308 level (positionally for day closing basis) for further upmove.
Positional targets if it gives a good breakout can be 339 and 367. Cash stock so please take less qty.
Learn & Earn,
Dr. Tanya Kumar
