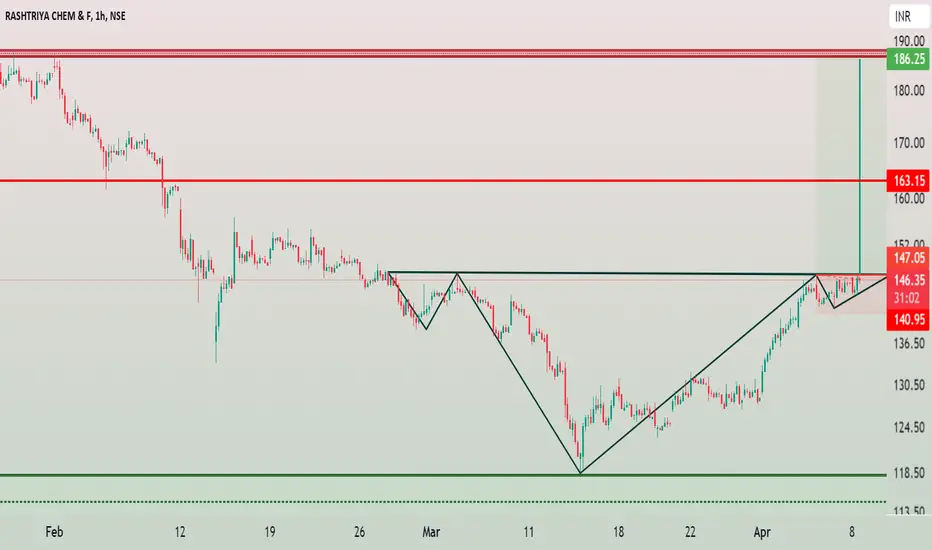
RCF - Head and Shoulder Chart PatternRashtriya Chemicals and Fertilizers Limited (RCF) has formed a bullish chart pattern called Head and Shoulder. Chart structure is bullish in every point of views like in a daily chart pattern you found RSI above 60 and also above 200 EMA is a very positive signal of uptrend.
Head is formed at very important zone which act as a resistance for than a decade almost (14 years). After successfully breakout of important resistance now price retest that level and formed strongest support zone with bullish piercing candlestick in daily timeframe. Change of Polarity, Prior resistance become support.
RCF buy above 148
Stop Loss below 142
Target 163 and 186
RCF trade ideas
RCF - Weekly AnalysisIn the Weekly Chart of RCF ,
we can see that; after the failure of its retesting, It has shown a recovery in W pattern.
Let it retest the same Trendline.
Expected momentum is shown in chart.

For Long Trade $NSE:RCFMention Information is only for Educational Purpose.
Dear Traders,
I hope this message finds you well. I wanted to share my view on
RCF with you. I Think that this stock got some potential to give good return
Stock: Rashtriya Chemicals and Fertilisers Ltd.
Entry Point: triggered
Stop Loss Point : 130
Target Point: 147,160,170
Please keep in mind that markets are inherently unpredictable, and there are no guarantees in trading. This view is based on my analysis as of Dated 02-april-2024, and conditions may change. It's important to do your own research and consider your risk tolerance before making any trading decisions .Feel free to reach out .Your feedback and insights are always appreciated.

RCF, easy 13%RCF broke through resistance and has received Navratna status from the Indian government. Hold for the long term, but swing traders can consider exiting at 141 .
Nifty #Nifty50 #Banknifty #Niftybank #Stockstowatch #StockmarketIndia #Stocks #GIFTNIFTY #StocksInFocus #swingtrading
🚨DYOR
🚨SL must, it depend's on your risk appetite


RCF : LONG TERM INVESTMENT IDEAPlease see details on the chart. I have included the fundamental analysis as well as my take on Technical - Price action.
This is a Investment Idea and not a 'trade'. No FnO please!
Please consult your investment advisor before investing.

RCF breakeout startedRCF breakeout started
a good fall will occure here
best for seller
follow for more

RCF - Monthly breakout after 15 yearsRCF gave a monthly breakout in December 2023 after trading within the same range for 15 years. The company has decent fundamentals, with the Government of India owning a majority of 75%.

RCF Analysis & PredictionRCF Analysis & Prediction
This is the analysis of RCF in Daily Time Frame. Watch carefully. The chart explains itself.
The stock managed to break the Rectangle Pattern with volume. This break out level may be retest in near future. If it will sustain above the breakout level, it is good for the stock. Generally Rectangle Pattern Breakout is a bullish signal for stocks.
There are some prediction levels. These Levels act as Support and Resistance according to position of price. You have to trade according to level breakout or breakdown.
Always maintain your risk management.
Book your profit according to your “STOMACH”.
Disclaimer:
This is not investment advice. I am not a SEBI Registered Analyst. Anything posted here is my own analysis and views. This is created for educational purposes only. Always consult your Financial Advisor before taking any decision or trade.
Happy trading.
About RCF :
Rashtriya Chemicals & Fertilizers Ltd. is an India based fertilizers manufacturing company. It operates through the following segments: Fertilizers, Industrial Chemicals, and Trading. The Fertilizers segment engages in the production and supply of various grades of fertilizers for agricultural use. The Industrial Chemicals segment engages in the production of various chemicals and supply to diverse industries. The Trading segment represents fertilizers imported / locally sourced and marketed for agricultural use. The company was founded on March 6, 1978 and is headquartered in Mumbai, India.

RCF Analysis - Don't miss this opportunityNSE:RCF
EDIT- 1st, 2nd, 3rd, 4th and 5th indicates attempts to break the trendline and not the date. The dates ( in MM/YYYY) are written below the attempt number.
Rashtriya Chemicals and Fertilizers Limited (RCF) manufactures and markets various kinds of fertilizers such as urea, bio-fertilizers, micro-nutrients, water soluble fertilizers, soil conditioners etc.
TTM EPS: 11.28
TTM PE: 8.39
Sector PE: 17.42
Book Value Per Share: 60.42
P/B: 1.57
Face Value: 10
Mkt Cap (Rs. Cr.): 5,218
Dividend Yield: 3.15
Some Positves:
Rising Net Cash Flow and Cash from Operating activity
Company with high TTM EPS Growth
Strong Annual EPS Growth
New 52 Week High
Effectively using its capital to generate profit - RoCE improving in last 2 years
Effectively using Shareholders fund - Return on equity (ROE) improving since last 2 year
Efficient in managing Assets to generate Profits - ROA improving since last 2 year
Increasing Revenue every Quarter for the past 4 Quarters
Strong cash generating ability from core business - Improving Cash Flow from operation for last 2 years
Company able to generate Net Cash - Improving Net Cash Flow for last 2 years
Annual Net Profits improving for last 2 years
Book Value per share Improving for last 2 years
Company with Zero Promoter Pledge
FII / FPI or Institutions increasing their shareholding
Stock gained more than 20% in one month
Strong Momentum: Price above short, medium and long term moving averages
Some Negatives:
Over the last 5 years, revenue has grown at a yearly rate of 0.23%, vs industry avg of 7.19%
Over the last 5 years, net income has grown at a yearly rate of 17.29%, vs industry avg of 31.88%
Over the last 5 years, market share decreased from 8.45% to 6.02%
If sanctions over Russia are withdrawn then it may have a negative impact on Indian fertilizer companies.
My Opinion: GoI is selling stake in RCF & NFL to reach Rs 23k crore disinvestment target. The company has double cash reserve than debt. Russia and Ukraine produce around 20-25% of global fertilizer production. The supply has taken hit and this presents a good opportunity for Indian companies. The volume indicates that the price will breakout the trendline this time. First target 100 above that 135-140 is very much possible in next 3 months.
NOT A RECOMMENDATION. JUST FOR EDUCATION. Thanks.

Rashtriya Chemicals And Fertilizers Ltd - Long Setup, Move is ON#RCF trading above Resistance of 166
Next Resistance is at 256
Support is at 111
Here is previous chart:
Chart is self explanatory. Levels of breakout, possible up-moves (where stock may find resistances) and support (close below which, setup will be invalidated) are clearly defined.
Disclaimer: This is for demonstration and educational purpose only. This is not buying or selling recommendations. I am not SEBI registered. Please consult your financial advisor before taking any trade.

Breakout in Rashtriya Chemicals And Fertilizers Limited (RCF)...Chart is self explanatory. Levels of breakout, possible up-moves (where stock may find resistances) and support (close below which, setup will be invalidated) are clearly defined.
Disclaimer: This is for demonstration and educational purpose only. This is not buying or selling recommendations. I am not SEBI registered. Please consult your financial advisor before taking any trade.

Rashtriya Chemicals & Fertilizers Ltd - Breakout #RCF
CMP ₹.170
Date : 02-01-2024
RCF is a PSU company engaged in the manufacturing and sales of fertilizers and chemicals. 75% promoter holdings with 0% pledge and a low debt company. Delivered good profit. ROCE & ROE improving. Debtor days improved, working capital cycle also improved. Overall fundamentals are improving. Now stock is in its 52 week high with significant volumes. Broken it's 2.5 year long resistance trend line. Also a round bottom breakout identified in charts. Expected to have a30% movement. Hopefully have all chances to become another FACT. Waiting for the fireworks . Stoploss at ₹.160-155 ranges.
Disclaimer : Post only for educational purpose. Not a buying / selling recommendation. This is only my personal view. I am not a SEBI registered analyst . Do your own analysis and act accordingly .

RCF Simple Analysis - BullsihOn request of @Loserboy69, NSE:RCF is in an Up-Trend.
Elliot's 3rd Wave is progressing in the Weekly Chart which should take the price up to 174.05. From the Current market price to this Target, there will be a 48% Return on Investment.
Price never moves up straight, so, it will create a lot of Corrective moves while going up to this target.
Holding and buying on dips will be a good idea.

16 Year Old Resistance Breakout-16 Year Old Breakout with high volume
-rsi showing strength
-above all crucial indicators


C&H A good C & H is formed with sufficient consolidation of price followed by a classic Price-Volume action.
The price target should be equal to the depth of the cup; above the lip of the cup.

RCF 15 year price breakout with Rounding Bottom
SL 121
Target : 276
Fertilizer stocks giving multi year breakout

RCF – 16 yrs range breakout – Multi-bagger in makingRCF has given 16 years range breakout above 150 levels.
Usually, such long consolidation breakouts are can turn out to be multi baggers (See recent moves in PFC, REC), at least 2x to 4x.
Target: 270+ and beyond on trailing basis.

RCF - Multiyear breakout - Huge potentialThe analysis is done on Weekly TF ad well as on Monthly time frame for bigger picture. The price may take few weeks to few months in order to reach the targets. Trade setup is explained in image itself. This is a continuation breakout chart.
Pls check the monthly chart here -
The above analysis is purely for educational purpose. Traders must do their own study & follow risk management before entering into any trade
Checkout my other ideas to understand how one can earn from stock markets with simple trade setups. Feel Free to comment below this or connect with me for any query or suggestion regarding this stock or Price Action Analysis.

RCF - Multiyear High StockRCF - Multiyear High Stock. Stock IS trying to BO 2008 High it seems that BO will be Done.
Volume is also Supported. Can give good return in Coming weeks and Months. As a Swing trader i try to Capture less but quality deals which can give good return in Weeks and Month.
Alays Focus on Risk Management and use Dips to buy these Multiyear High Stocks.
Remember: I am a Price Action Trader and use Price and Volume together with different Timeframes, including RSI, and market conditions. To get best result always wait for confirmation. Focus on Risk Management and Position sizing.
I use Trading view for my Analysis and charts Repositories. I could have Or Couldn’t have positions in Sharing Ideas.
Treat trading like a business and it will pay you like a business…..!!
Hope this post is helpful to community
Thanks
RastogiG
For Tradingview Premium plan, Can go with the below link
in.tradingview.com
Disclaimer and Risk Warning.
I am not Sebi registered analyst. The analysis and discussion provided on in.tradingview.com
is intended for educational purposes only and should not be relied upon for trading decisions. RastogiG is not an investment adviser and the information provided here should not be taken as professional investment advice. Before buying or selling any investments, securities, or precious metals, it is recommended that you conduct your own due diligence. RastogiG does not share in your profits and will not take responsibility for any losses you may incur. So Please Consult your financial advisor before trading or investing.

RCF, CMP 152.5Hovering Near Multi Year Breakout.
Stock Price Less Than Its Intrinsic Value.
Good Volume Recently.
Target 248, Do Your Research.

Resistance BreakoutPlease look into the chart for a detailed understanding.
Consider these for short-term & swing trades with 2% profit.
For BTST trades consider booking
target for 1%-2%
For long-term trades look out for resistance drawn above closing.
Please consider these ideas for educational purpose
Please note that, if there are some big targets, those are drawn thinking for long term.
