RCF - DAY CHART - 28.12.2022 - BAHAVAN CAPITALRASHTRIYA CHEMICALS & FERTILIZERS as per Day Chart Analysis
ABOVE 137 TARGET 140
For the last four sessions FII had been selling and DII only in Marginal Buying.
Hence tomorrow being month end expiry trade safely....
Happy Profitable Trading to All.
Advance Happy New Year 2023 wishes to all....
RCF trade ideas

RCF - Ichimoku Bullish Breakout Stock Name - Rashtriya Chemicals And Fertilizers Limited
Ichimoku Cloud Setup :
1). Today's close is above the Conversion Line
2). Future Kumo is Turning Bullish
3). Chikou span is slanting upwards
All these parameters are showing bullishness at Current Market Price
and more bullishness AFTER crossing 145.
#This is not Buy and Sell recommendation to any one. This is for education purpose and a helping hand to learn trading in Market.
# Cloud Trading
# Ichimoku Cloud
# Ichimoku Followers
I hope you all like my analysis.
Please do share your thoughts into comment section.
Please give a like, share & subscribe for daily analysis.

Rashtriya chemical and fertilizers Brk out after multiple year
So keep on radar
.
Invest at ur own risk✌️

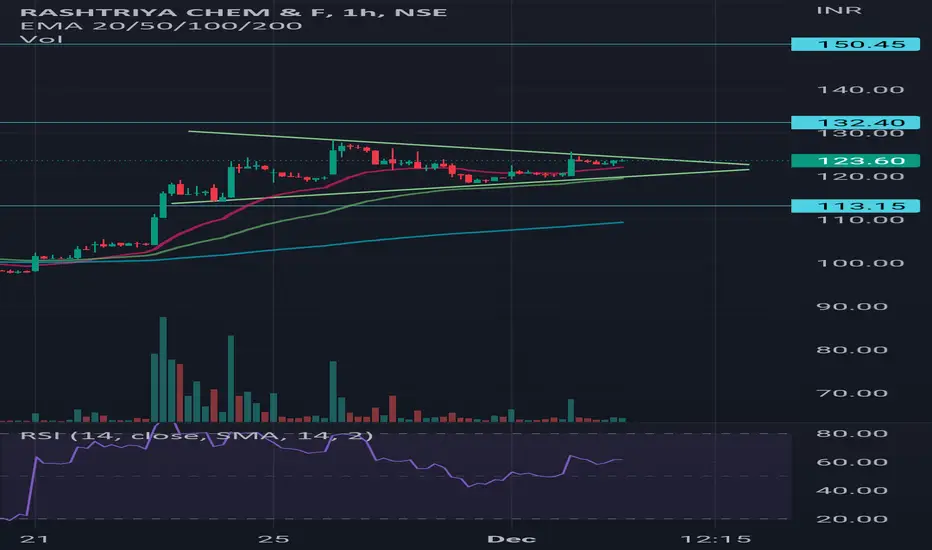
RCF ANALYSIS Formation of bullish flagpole
HHHL formation with strong volume
Nearterm targets of 132 & 150
Strong support near 110

Price of this fertilizer player is going off the charts!A little late in posting this but the risk to reward is still favorable!
NSE:RCF is an India-based fertilizer and chemical manufacturing company.
The Company manufactures Urea, Complex Fertilizers, Bio-fertilizers, Micro-nutrients, water soluble fertilizers, soil conditioners and a range of Industrial Chemicals.
The Company operates through the segments, including Fertilizers, Industrial Chemicals and Trading.
Fertilizers segment engaged in production and supply of various grades of Fertilizers for agricultural use.
Industrial Chemicals segment engaged in production of various chemicals and supply to diverse Industries.
Trading segment engaged in fertilizers imported / locally sourced and marketed for agricultural use.
Besides fertilizer products, the Company also produces a range of industrial chemicals that are important for the manufacture of dyes, solvents, leather, pharmaceuticals and a host of other industrial products.

RCFBuy above 104 with volumes and ride the trend till targets
Volume support on right
VCP pattern
Positive RS

Rashtriya Chem & Fert : +57% Upside PotentialRCF 23 Nov 2022
Stock BO with strong volume today from a consolidation of 2 months, we can witness a follow-through.
In Play : HH-HL
Summary
- Stock bounced from the VAH zone
- 2 months of accumulation
- Inv Head and Shoulder pattern(Confirmed BO)
- ATH is at 150.45
Conclusion
- CMP 118.40
- 3% Test position can be initiated
- Rest Qty can be planned on RT of TL
- Higher targets could be around
• Short Term – 126/148
• Long Term – 176(ATH @ 150.45) need to see price action in the ATH zone to confirm
Wish You Happy & safe trading
Views are for ‘’EDUCATIONAL PURPOSE ONLY’’ trade at your own risk.
"Always Respect Risk"
Happy Trading
Jai Hind Jai Bharat

RCFCMP 123.60
CAN GO 140-160 in short term and maybe multi bagger in 2023
SL 104 monthly closing basis

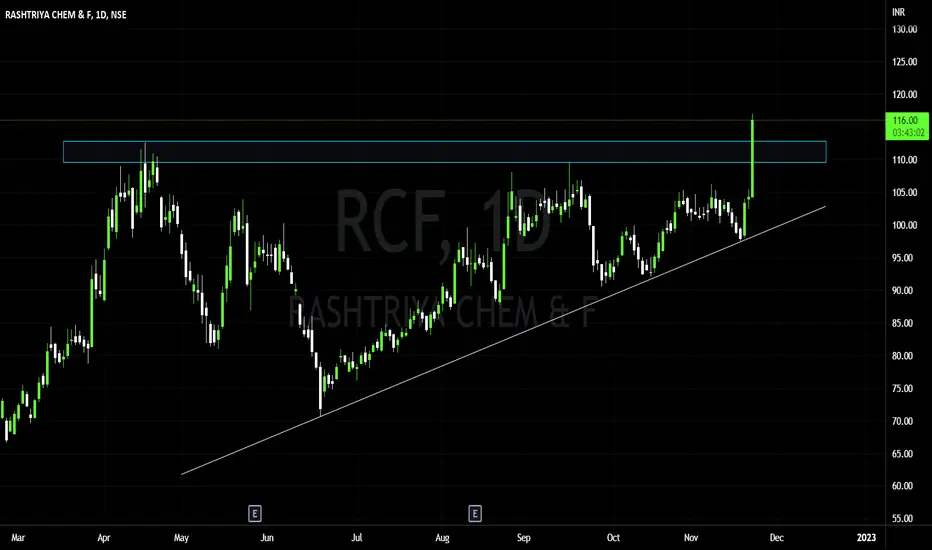
RCF weekly TFRCF is at 12 years strong horizontal resistance line on weekly TF.
Since January 2021 it has been moving within blue colour
channel and trying to break out of the blue channel and also the
strong horizontal resistance line.
Good volume is seen.
Weekly RSI is @ 66.
We can get a 60 points up move if it sustains above
the 12 years strong horizontal TL/
SL is 88-90.

Weekend pick: RCFChart -> RCF Weekly
A cup and handle breakout in RCF, with volume confirmation.
CMP: 119
Targets: 135, 165 and 200
Good range: Around 110
SL: 97.50 weekly close
Disclaimer: This is for educational purposes only, not any recommendations to buy or sell. As I am not SEBI registered, please consult your financial advisor before taking any action.

RCF into multi year breakout.Stock will give a try to breakout the 2008 levels. Solid price action today. Since it has rallied a lot, risk reward is a bit unfavourable. One can enter with 50% of normal quantity with an sl of 109 on cbsl.
Also 118-120 level to lookout

RCF CnH BO after 4 years#RCF showing a good BO after 4 years and forming CnH. Can be taken for 130/150 in midterm
SL 90.

Long RCFRCF is now in breakout, This is string breakout. One can buy and hold.
PSU is going upnow days due to government decisions towards betterment of PSU

Resistance BreakoutPlease look into the chart for a detailed understanding.
Consider these for short-term & swing trades with 2% profit.
For BTST trades consider booking profit for 1% - 2%
For long-term trades look out for resistance drawn above closing

Rashtriya Chemicals & Fertilizers Ltd.Rashtriya Chemicals & Fertilizers Ltd.
ABOUT
Rashtriya Chemicals & Fertilizers is a public sector undertaking (PSU) with a 75% stake owned by GOI. The company is engaged in the manufacturing and marketing of fertilizers and industrial chemicals.
Manufacturing Facilities
It has two operating units, one at Trombay in Mumbai and the other at Thal, Raigad district, about 100 KM from Mumbai.
Products
RCF manufactures Urea, Complex Fertilizers, Bio-fertilizers, Micro-nutrients, 100 percent water-soluble fertilizers, soil conditioners, and a wide range of Industrial Chemicals
Production capabilities
The Thal unit produced 19.12 lakh MT of Urea compared to 20.22 lakh MT produced during the previous year. In terms of nutrients in the fertilizers, the unit produced 8.80 lakh MT of N during the year, compared to 9.30 lakh MT during the previous year.
The Trombay Unit produced 3.38 lakh MT of Urea & 5.37 lakh MT of Suphala 15:15:15 in FY21 compared to 3.26 lakh MT of Urea & 5.71 lakh MT of Suphala 15:15:15 produced during the previous year. In terms of Nutrient values, the unit produced 2.36 lakh MT of N, 0.81 lakh MT of P2 O5, and 0.81 lakh MT of K2 O during the year compared to 2.36 lakh MT of N, 0.86 lakh MT of P2 O5, and 0.86 lakh MT of K2 O respectively during the previous year.
TECHNICAL ANALYSIS.
Time Frame - 1D.
1. Stock closes on its previous 2 highs. which is in (Jan 2018 & Apr 2022).
2. Very high traded and delivered Qty.
FUNDAMENTAL ANALYSIS.
Sector: Fertilizers
1. Market Cap - ₹ 6,419 Cr.
2. Stock P/E - 6.84
3. Price to book value - 1.44
4. Debt to equity - 0.69
5. Free Cash Flow - ₹ -717 Cr.
DISCLAIMER - All analyses are for educational purposes. it is not trading or investment advice.
#education #markets #equities #stockmarket #technicalanalysis #stocks #investment #trading #india #finance #fundamentalanalysis #nse #bse #supertrend #education #investing #investments #financialmarkets #learningeveryday #learning #RCF #fertilizers

17 Years Multiyear Rectangle Consolidation Breakout at RCF 17 Years #Multiyear Rectangle Consolidation #Breakout at #RCF (Rashtriya Chemicals & Fertilizers Ltd) Weekly Chart. Its #Outperformed #Nifty
What Is a Rectangle?
A rectangle is a pattern that occurs on price charts. A rectangle is formed when the price reaches the same horizontal support and resistance levels multiple times. The price is confined to moving between the two horizontal levels, creating a rectangle. The concept of a rectangle is similar to a Darvas Box.
KEY TAKEAWAYS -
1. A rectangle occurs when the price is moving between horizontal support and resistance levels.
2. The pattern indicates there is no trend, as the price moves up and down between support and resistance.
3. The rectangle ends when there is a breakout, and the price moves out of the rectangle.
Some traders like to trade the rectangles, buying near the bottom and selling or shorting near the top, while others prefer to wait for breakouts.
ONLY FOR #educational
NOT SEBI REGISTERED. #LEARNEARN (TRUST YOURSELF)
#nifty50 #sharemarket #BREAKOUTSTOCKS #Multibagger #sharemarket #sharemarketindia #sensex #technicalanalysis #Chartanalysis #headandshoulders #doubletop #doublebottom #parallelchannel #relativestrength
DISCLAIMER: I am not SEBI registered analyst. All posts are for educational purpose only. I am not responsible for your any loss or profit. Consult your adviser before taking any trade. I help people to learn technical analysis & charts reading.

RCF - Triangle pattern breakout - 100% upside potentialRCF has been within a triangle pattern range (for 14 years since Jan'08) which seems to have broken out now at around 112 range with good buying volumes.
Target is coming to 200+
SL: Daily close below 105
Target timeframe: 6 months to 1 year.

intraday, swing, short termintraday opportunity is there, huge volume also there.
we can see all time high and also new high in coming days
nifty is also supporting
midcap stocks are going to boom.
long term investment; min 70% return
huge potential is there.
investment ;
if you are intrested in investmet, go for it with small risk,
more possibility is there for breakout.

RCF: Breaking out with strong sectoral movementRashtriya Chemicals & Fertilizers Ltd
PC-B1=PC-B2
#WondersOfPC
Technicals:
• Strongly Breakout Bigger channel, PC-A at 104
• Crossing strongly above recent Resistance of R1 & R2
• Taller green towers in volume
• RSI is in Bullish Zone
• Relative Strength is in green
• Strong upside move in Fertilizer Sector
Levels for position:
Entry: 110-115 levels
ST Target: 1st 130, then 150
SL on closure basis: 104.45

#RCFA good fundamental stock posted a fantastic result and promoters holding consistent 75%, FII and DII increased their stakes and completing round bottom pattern in weekly time frame.

Expecting Breakout ✌✌✌This scrip is expected to give breakout in the coming days as it is on the verge of breakout. So traders keep on your radar to catch the momentum. Thanks to all 🙏🙏🙏
