Reliance- A great company to add to portfolio
Hello,
Reliance Industries Ltd. engages in hydrocarbon exploration and production, petroleum refining and marketing, petrochemicals, retail, and telecommunications. It operates through the following segments: Oil to Chemicals (O2C), Oil & Gas, Retail, Digital Services, Financial Services, and Others.
Quarterly Performance (3Q FY25 vs 3Q FY24)
Gross Revenue increased by 7.7% Y-o-Y to ₹ 267,186 crore ($ 31.2 billion)
JPL revenue increased by 19.2% Y-o-Y due to continuing flow through of tariff revisions for mobility services, and healthy growth in homes and digital services businesses.
RRVL revenue increased by 8.8% Y-o-Y with growth across consumption baskets driven by festive buying and wedding season.
Oil to Chemicals (O2C) revenue improved by 6% Y-o-Y with higher volumes and increased domestic product placement. Planned shutdown of major units during the same quarter last year impacted volumes.
Marginally lower KGD6 volumes and fall in price realisations for CBM and condensate led to 5.2% decline in Oil and Gas segment revenue.
EBITDA increased by 7.8% Y-o-Y to ₹ 48,003 crore ($ 5.6 billion)
JPL EBITDA increased by 18.8% Y-o-Y driven by higher subscriber base, improving ARPU
and favorable mix.
RRVL EBITDA increased by 9.5% with improved operational efficiencies and superior store operating metrics.
O2C EBITDA increased by 2.4% supported by higher volumes and operational flexibility.
Efficient feedstock sourcing, higher domestic product placement and improved polymer deltas offset weak fuel cracks.
Oil and Gas segment EBITDA decreased by 4.1% largely on account of decline in volumes and price realisations.
Depreciation increased by 2.2% Y-o-Y to ₹ 13,181 crore ($ 1.5 billion).
Finance Costs increased by 6.7% Y-o-Y to ₹ 6,179 crore ($ 722 million), primarily due to higher debt balance. However, net debt remained largely flat.
Tax Expenses increased by 7.8% Y-o-Y to ₹ 6,839 crore ($ 799 million).
Profit After Tax and Share of Profit/(Loss) of Associates & JVs increased by 11.7% Y-o-Y to ₹ 21,930 crore ($ 2.6 billion).
Capital Expenditure for the quarter ended December 31, 2024, was ₹ 32,259 crore ($ 3.8 billion).
Below are the opportunities for the business.
Reliance
Reliance Retail targets 20% annual growth, doubling the market’s 10% CAGR.
Reliance plans 20GW solar PV by 2026, battery production, and strategic investments in O2C and O&G.
Risks to consider before investing
High freight costs, limited market presence, and balancing sustainability with profitability amid global over-capacity.
Tight crude supply, regulatory impacts on fuel, and competition from Chinese exports and trade agreement imports.
Our view.
I see an opportunity to buy reliance from the current point both from a technical perspective as well as fundamental analysis. The company is well aligned to capitalise on future growth. Zero crossover on the MACD indicator will confirm the buy bias.
Good luck.
RELIANCE trade ideas
candlestick patterns **SkyTradingZone** is your go-to source for educational content on trading, covering market insights, strategies, and in-depth analysis. Our goal is to empower traders and investors with knowledge to navigate the markets effectively.
---
# **Candlestick Patterns – Part 1: Basics and Key Reversal Patterns**
Candlestick patterns are one of the most powerful tools in **technical analysis**. They help traders understand market sentiment and predict future price movements based on past price action.
📌 **Why Use Candlestick Patterns?**
✅ They provide **visual insights** into price action.
✅ They help identify **market reversals, trend continuations, and breakouts**.
✅ They work well when combined with **support & resistance, volume, and indicators** like RSI or MACD.
---
## **1️⃣ Understanding Candlestick Structure**
A candlestick consists of **four key components**:
📌 **Open** – The price at which the candle starts.
📌 **Close** – The price at which the candle ends.
📌 **High** – The highest price reached during the timeframe.
📌 **Low** – The lowest price reached during the timeframe.
🔹 **Bullish Candle (Green/White):** When the **closing price** is higher than the **opening price**, showing buyers are in control.
🔹 **Bearish Candle (Red/Black):** When the **closing price** is lower than the **opening price**, showing sellers are in control.
---
## **2️⃣ Types of Candlestick Patterns**
Candlestick patterns can be broadly classified into **two types**:
✅ **Reversal Patterns** – Indicate a possible change in trend.
✅ **Continuation Patterns** – Indicate that the trend will likely continue.
---
## **3️⃣ Key Reversal Candlestick Patterns**
### 📍 **A) Bullish Reversal Patterns**
1️⃣ **Hammer**
🔹 A small body with a **long lower wick** (shadow).
🔹 Appears after a **downtrend**, signaling a potential reversal.
🔹 **Indicates buyers have entered the market aggressively.**
📌 **Confirmation:** The next candle should be bullish with high volume.
🔹 **Example:** If Nifty 50 forms a hammer at a key **support level**, it could signal a trend reversal.
---
2️⃣ **Bullish Engulfing**
🔹 A **large green candle** completely engulfs the previous **red candle**.
🔹 Shows **strong buying pressure**, often leading to an **uptrend**.
📌 **Confirmation:** Must occur at a **support level or after a downtrend**.
🔹 **Example:** If a stock forms a **bullish engulfing pattern near a 200-day moving average**, it’s a strong buy signal.
---
3️⃣ **Morning Star**
🔹 A **three-candle pattern** appearing after a **downtrend**:
✅ First Candle – Large **red candle** (sellers in control).
✅ Second Candle – Small **indecisive candle** (doji/spinning top).
✅ Third Candle – Large **green candle**, confirming reversal.
📌 **Confirmation:** The third candle should close above the first candle’s midpoint.
🔹 **Example:** A **Morning Star on Bank Nifty's daily chart** at a key support zone can indicate a bullish rally ahead.
---
### 📍 **B) Bearish Reversal Patterns**
1️⃣ **Shooting Star**
🔹 A small body with a **long upper wick**.
🔹 Appears after an **uptrend**, signaling a potential reversal.
🔹 Shows that **buyers tried to push prices higher but failed, and sellers took control**.
📌 **Confirmation:** The next candle should be bearish with strong volume.
🔹 **Example:** If **Reliance stock** forms a **shooting star** near resistance, it could indicate a **sell-off**.
---
2️⃣ **Bearish Engulfing**
🔹 A **large red candle** completely engulfs the previous **green candle**.
🔹 Indicates **strong selling pressure** and potential **trend reversal**.
📌 **Confirmation:** Must occur at a **resistance level or after an uptrend**.
🔹 **Example:** A **Bearish Engulfing pattern on the Nifty 50 weekly chart** near a **key resistance level** signals weakness in the index.
---
3️⃣ **Evening Star**
🔹 A **three-candle pattern** appearing after an **uptrend**:
✅ First Candle – Large **green candle** (buyers in control).
✅ Second Candle – Small **indecisive candle** (doji/spinning top).
✅ Third Candle – Large **red candle**, confirming reversal.
📌 **Confirmation:** The third candle should close below the first candle’s midpoint.
🔹 **Example:** An **Evening Star on HDFC Bank’s chart** near all-time highs may signal a bearish reversal.
---
## **4️⃣ How to Trade Candlestick Reversal Patterns?**
📌 **Step 1:** Identify the pattern at a **key support or resistance level**.
📌 **Step 2:** Wait for **confirmation** from the next candle.
📌 **Step 3:** Use **indicators like RSI, MACD, or Volume** for extra confirmation.
📌 **Step 4:** Enter a trade with a **stop-loss below/above the pattern’s wick**.
📌 **Example Trade Setup:**
✅ If a **Hammer pattern forms at a support level with increasing volume**, go **long**.
✅ Place **stop-loss** below the candle’s wick.
✅ Target **previous resistance levels** for profit-taking.
---
## **5️⃣ Common Mistakes to Avoid When Using Candlestick Patterns**
❌ **Trading Patterns in Isolation** – Always combine with support/resistance and indicators.
❌ **Ignoring Volume Confirmation** – A strong reversal needs high volume support.
❌ **Entering Without Confirmation** – Wait for a confirming candle before taking a trade.
❌ **Using Too Many Patterns** – Stick to **high-probability setups** like Engulfing, Hammer, and Shooting Star.
📌 **Pro Tip:** The best traders use **candlestick patterns along with market structure, trendlines, and momentum indicators** for higher accuracy.
---
## **Final Thoughts – Why Candlestick Patterns Are Important?**
🚀 **Candlestick patterns provide an edge in understanding market psychology and potential price movements.**
📌 **To Master Candlestick Trading:**
✅ Learn to identify **reliable reversal and continuation patterns**.
✅ Combine with **key support/resistance levels**.
✅ Backtest patterns to see which works best in different market conditions.
By mastering **Candlestick Analysis**, traders can significantly improve their decision-making and **increase profitability in the stock market!** 📈💰
---
📌 **Coming Up Next in Part 2:** **Continuation Candlestick Patterns (Doji, Spinning Tops, Three Soldiers, etc.) and How to Use Them in Trading.**
🔹 **Disclaimer**: This content is for educational purposes only. *SkyTradingZone* is not SEBI registered and does not provide financial or investment advice. Please conduct your own research before making any trading decisions.

Reliance Industries Ltd.**Reliance Industries Ltd. (RELIANCE) Stock Analysis**
**Company Overview:**
Reliance Industries Ltd. is one of India's largest conglomerates, with operations spanning across several sectors including petrochemicals, refining, oil and gas exploration, retail, and telecommunications. It holds a dominant position in the Indian market with its diversified businesses, and the company is known for its significant impact on India's economic development, particularly in the telecom and retail industries through its Jio and retail businesses.
**Fundamental Analysis:**
- **Market Capitalization:** Approximately ₹16.61 trillion.
- **Price-to-Earnings (P/E) Ratio:** The stock trades at a P/E ratio of 24.01, which is above the industry average, indicating that the stock is priced at a premium in anticipation of future growth.
- **Earnings Per Share (EPS):** ₹51.13, showing the company's strong profitability in terms of earnings generated per share.
- **Return on Equity (ROE):** 8.29%, suggesting moderate efficiency in generating profits from shareholders' equity.
- **Debt-to-Equity Ratio:** 0.44, indicating that Reliance maintains a balanced approach to using debt in its capital structure, with a moderate reliance on borrowing.
- **Dividend Yield:** 0.41%, which is on the lower side, reflecting a conservative dividend payout policy.
**Technical Analysis:**
- **Current Price:** ₹1,227.70.
- **52-Week Range:** The stock has traded between ₹978.15 and ₹1,608.95 during the past year, displaying significant price volatility.
- **Support Levels:**
- First Support: ₹1,200.00
- Second Support: ₹1,150.00
- **Resistance Levels:**
- First Resistance: ₹1,300.00
- Second Resistance: ₹1,350.00
- **Breakout Point:** A sustained move above ₹1,300.00 could signal the start of a bullish trend, potentially bringing more investors into the stock.
- **Retest Levels:** If the stock breaks above ₹1,300.00, a retest of this level would confirm it as a new support level, solidifying a stronger trend.
**Recent Performance:**
- **1 Week:** The stock has increased by 0.75%.
- **1 Month:** The stock has decreased by 3.92%, reflecting a period of downward pressure.
- **6 Months:** The stock has decreased by 16.35%, underperforming compared to broader market indices.
**Analyst Ratings:**
- **Morgan Stanley:** Maintains an 'Overweight' rating with a target price of ₹1,606, suggesting a 31% upside from the current market price.
- **JP Morgan:** Holds an 'Overweight' rating, with a potential upside of up to 25% from current levels.
**Conclusion:**
Reliance Industries Ltd. continues to be a key player in the Indian market, with strong fundamentals and diversified business operations. Despite its elevated P/E ratio and some short-term underperformance, it remains a long-term growth candidate due to its dominant position in sectors like telecom and retail. Traders should watch key support levels at ₹1,200.00 and ₹1,150.00, and be alert for potential breakout opportunities above ₹1,300.00 for further upside momentum.
*Please note that stock market investments carry inherent risks. It is advisable to conduct thorough research or consult with a financial advisor before making investment decisions.*

what is support and resistance ?**Support and resistance** are key concepts in technical analysis that help traders identify potential price levels where an asset's price might reverse, stall, or break through. They represent areas on a chart where the price has historically had difficulty moving past in a particular direction. These levels are crucial for understanding market behavior, making decisions, and managing risk.
### **What is Support?**
**Support** is a price level at which an asset tends to find **buying interest**, preventing the price from falling further. It's considered a "floor" for the price, where demand is strong enough to halt or reverse a downward movement.
- **Why does support form?**: When the price falls to a certain level, buyers typically believe the asset is undervalued, leading to an increase in demand. As a result, the price tends to bounce off this level and move higher.
- **Support Level**: The more times the price bounces off a level and doesn’t break below it, the stronger the support is considered to be.
#### **Characteristics of Support**:
- Price tends to “bounce” off support.
- The more times the price has touched this level without breaking below it, the stronger the support.
- In an uptrend, the price might pull back to support and then continue its upward movement.
### **What is Resistance?**
**Resistance** is the opposite of support. It is a price level where an asset tends to face **selling pressure**, preventing the price from rising further. It's seen as the "ceiling" for the price, where supply exceeds demand, often causing the price to reverse downward.
- **Why does resistance form?**: When the price rises to a certain level, traders or investors might think the asset is overvalued, leading them to sell, which creates selling pressure. This selling pressure prevents the price from moving above the resistance level.
- **Resistance Level**: Similar to support, the more times the price touches this level without breaking above it, the stronger the resistance is considered to be.
#### **Characteristics of Resistance**:
- Price tends to “bounce” down from resistance.
- The more times the price has touched this level without breaking above it, the stronger the resistance.
- In a downtrend, the price might rise to resistance and then continue its downward movement.
### **How to Use Support and Resistance in Trading**
1. **Identifying Entry and Exit Points**:
- **Buying near support**: Traders may look for buying opportunities when the price approaches a support level, anticipating that it will bounce upward.
- **Selling near resistance**: Traders may look for selling opportunities when the price nears a resistance level, expecting it will reverse downward.
2. **Breakouts**:
- If the price **breaks through** a **support** or **resistance** level, it can signal the beginning of a new trend.
- A **breakout** above resistance may indicate the start of an uptrend (bullish breakout).
- A **breakdown** below support may indicate the start of a downtrend (bearish breakdown).
- Breakouts often come with higher volume and momentum, providing confirmation that the price may continue in the direction of the breakout.
3. **Trend Reversals**:
- **Support turning into resistance**: After a price breaks below support, that same level may act as **resistance** on a price rally. This is known as a "reversal" of roles.
- **Resistance turning into support**: After a price breaks above resistance, that level may now act as **support** in case the price pulls back. This is called a "role reversal."
4. **Consolidation Zones**:
- When price moves within a range between support and resistance, it’s considered **consolidation**. Traders often trade this range by buying at support and selling at resistance, anticipating that the price will remain within the range until it breaks out.
### **Support and Resistance in Practice**
#### **Example of Support**:
- Imagine a stock has been trading at $50 and repeatedly bounces off this level without going lower. Traders will see this as a strong **support level** at $50, where they may place buy orders anticipating a bounce.
#### **Example of Resistance**:
- Similarly, if a stock has been trading at $60 and has failed to move higher than this price on several occasions, $60 is a **resistance level**. Traders might place **sell orders** near $60, expecting the price to reverse and go back down.
---
### **Types of Support and Resistance**
1. **Horizontal Support and Resistance**:
- These are the most straightforward types, where the price repeatedly bounces at a particular level (flat price level) on the chart.
- Example: If the price of a stock frequently stops falling at $50 and rises back up, $50 is a horizontal support level.
2. **Trendline Support and Resistance**:
- Trendlines are diagonal lines that connect significant lows for support or significant highs for resistance.
- Example: In an uptrend, a **trendline support** is drawn by connecting the lows of the price, and in a downtrend, a **trendline resistance** is drawn by connecting the highs.
3. **Moving Average Support and Resistance**:
- Moving averages, such as the **50-day** or **200-day moving average**, can also act as dynamic levels of support or resistance. If the price is above the moving average, the moving average can act as support; if the price is below it, the moving average can act as resistance.
---
### **Importance of Support and Resistance in Trading**
- **Market Psychology**: Support and resistance reflect the **psychology of the market**—buyers are willing to buy at support, and sellers are willing to sell at resistance. These levels give insight into where market participants are likely to take action.
- **Risk Management**: Support and resistance levels are often used for **setting stop-loss** and **take-profit** levels. Traders may place a stop-loss just below support when buying or just above resistance when selling to limit potential losses.
- **Predicting Future Price Movements**: By understanding where support and resistance levels are, traders can anticipate potential price movements. When the price approaches one of these levels, it gives traders insight into how the market might react.
---
### **Conclusion**
Support and resistance are essential tools in technical analysis that help traders identify price levels where an asset might reverse, stall, or break through. Understanding how to read and apply these levels can provide valuable insights into market trends and price movements. By combining support and resistance with other technical indicators and analysis, traders can improve their entry and exit decisions, manage risk, and enhance their overall trading strategies.

Reliance Closed Below Danger level Now Time To Create New Short As of the latest available data, Reliance Industries Limited (RIL) is trading at approximately ₹1,199.60 per share, reflecting a 0.62% decline from the previous close. citeturn0news28 The stock remains 25.44% below its 52-week high of ₹1,608.95, reached on July 8, 2024. citeturn0search6
In recent developments, RIL's subsidiary, Jio Platforms, is developing a cloud-based AI personal computer accessible on any device, aiming to facilitate compute-intensive AI applications at low cost. citeturn0search3 Additionally, Reliance Retail has launched the Shein India Fast Fashion app, marking Shein's return to the Indian market after a previous ban. citeturn0news38
These initiatives underscore RIL's commitment to innovation and market expansion, potentially influencing its stock performance in the near future.
navlistRecent Developments in Reliance Industriesturn0news29,turn0news38,turn0news39
view on Reliance IndustriesStock name: Reliance Industries
current price: 1200
current support at 1200-1180, it can retest 1220-1240 and may remain in 1240-11800 range.
below 1180 stock can see more fall to 1150-1110
If it breaks resistance above 1240, upside target would be 1290+

RelianceH&S pattern observed on 125 mins
Nifty index also looks weak and Rel in weak condition make it a confirmation
Brace yourself from fresh buy

what is Database trading ?**SkyTradingZone** is your go-to source for educational content on trading, covering market insights, strategies, and in-depth analysis. Our goal is to empower traders with knowledge to navigate the markets effectively.
---
## **What is Database Trading?**
### **1️⃣ Introduction to Database Trading**
Database trading is a systematic approach to trading that involves collecting, storing, and analyzing large amounts of market data to make informed trading decisions. It is widely used by hedge funds, quantitative traders, and algorithmic traders to gain a statistical edge in the market.
### **2️⃣ How Database Trading Works**
Database trading relies on:
✅ **Data Collection** – Gathering historical and real-time market data.
✅ **Data Storage** – Using databases like SQL, MongoDB, or cloud-based storage.
✅ **Data Analysis** – Identifying patterns, trends, and inefficiencies.
✅ **Automated Execution** – Placing trades based on predefined conditions.
---
## **3️⃣ Components of a Database Trading System**
### 🔹 **1. Market Data Collection**
- Data sources: TradingView, Binance API, Alpha Vantage, Yahoo Finance, Quandl.
- Data types:
✅ **Price data** (OHLC – Open, High, Low, Close)
✅ **Volume data**
✅ **Order book data**
✅ **Sentiment data** (News, social media)
### 🔹 **2. Database Management**
- **SQL Databases** (PostgreSQL, MySQL) for structured data storage.
- **NoSQL Databases** (MongoDB, Firebase) for unstructured data.
- **Cloud Storage** (AWS, Google Cloud) for scalability.
### 🔹 **3. Data Analysis & Strategy Development**
- **Statistical Analysis:** Mean, median, standard deviation of price movements.
- **Backtesting:** Testing strategies on historical data before applying them live.
- **Machine Learning:** Predicting price movements using AI models.
### 🔹 **4. Trade Execution & Automation**
- **Python-based bots** using APIs like CCXT, Alpaca, Binance API.
- **Algorithmic Trading:** Executing trades based on programmed logic.
---
## **4️⃣ Why Use Database Trading?**
📊 **Reduces Emotional Trading** – Trades are executed based on data, not emotions.
📈 **Enhances Strategy Accuracy** – Backtested strategies improve success rates.
🔄 **Scalability** – Can be applied to multiple markets (stocks, forex, crypto).
🏦 **Institutional-Level Trading** – Aligns with hedge fund and quantitative strategies.
### **Next Steps in Database Trading**
In upcoming sections, we will cover:
✅ **How to Collect and Store Market Data**
✅ **Setting Up a Trading Database**
✅ **Backtesting & Automating Strategies**
Stay tuned for more advanced insights!
---
🔹 **Disclaimer**: This content is for educational purposes only. *SkyTradingZone* is not SEBI registered, and we do not provide financial or investment advice. Please conduct your own research before making any trading decisions.

Reliance buy 1200 near for long term sl 1140 target 1340-60How to take trades using Harmonic pattern projection Trade setup is explained below :-
Entry : 1st SL point : 0% is recent top or bottom.
Trailing D: 11.4% is work as trailing SL of buy or sell trade if hit then we have to book profit
.If price goes below 2nd D 21.4% then early traders can make fresh reversals trade after breaking 1st D 11.4% safe traders can reversal trade after breaking 2nd D 21.4%
Targets :
Target T1 : 28.3% ( early trade if entry at 11.4% )
Target T1 : 35.1% to 38.2%
Target T3 : 50.1% to 53.2%
T3: 61.8% to 65.1% is our 3rd Target since this is reversal zone so must book profit if break then take fresh trade again
Target T4 : 76.4% to 79.7%
Next Targets are 100% , 127.2% ,141.4% and final Target 161.8%.
How to take reversal trade :
If price going upside/ downside then then buy or sell levels appear on Chart ( Automatically show when price reach any reversal zone of harmonic projection pattern based .
After showing reversal levels wait for confirmation until 21.4% or 28.3 % level not break if break then exit from current buy / sell trade and take fresh reverse trade buy/ sell .
Trailing SL:
After reach 1st Target trail SL to just above or below cost ( for example we are holding sell trade from 100 1st Target 110 hit then move trailing sl to 104-105 and move SL as price move upside or Downside)
Re- Entry :
For Re-entry in any pull back Point D ( 11.4% ) is used for re-entry then SL recent high or low Point D ( 0% ) .
Target is same as early 21.4% , 28.3 , 35.1 and so on
Blue Line is 1st support/ Resistance
Green line is 2nd support/ resistance
Red line is 3rd Support/ resistance

Fear vs Greed in Trading:-Emotional Battle Behind Every DecisionHello Traders!
Today, let’s dive into a topic that all of us, as traders, deal with on a daily basis: Fear vs. Greed . Both emotions play a huge role in how we make decisions in the market, but which one truly affects traders more? Let’s break it down!
The Power of Fear
Fear can be a major barrier for traders. It often causes us to pull the trigger too early, sell too soon, or avoid taking positions altogether. It’s the feeling of uncertainty that can make us second-guess our analysis or follow the crowd into a trade, even when we’re not sure about it.
Fear of loss : One of the most common reasons traders sell too quickly.
Overthinking : Fear often leads to overanalyzing charts, which can result in missed opportunities.
Avoidance : Some traders let fear prevent them from entering trades, waiting for the “perfect” moment that never comes.
The Grip of Greed
Greed , on the other hand, can be equally dangerous but in the opposite way. It often drives traders to take excessive risks, push positions beyond their limits, or hold onto winning trades for too long, hoping for a bigger profit.
Chasing big returns : Traders sometimes risk too much, hoping for that "huge" win.
Holding on too long : Greed can make us ignore stop-losses and let profits slip away.
Overconfidence : Greed feeds into overconfidence, which can cloud judgment and lead to impulsive decisions.
Which Affects Traders More?
It’s tough to say definitively whether fear or greed affects traders more because they both can act simultaneously, influencing decisions in different ways. However, from experience, many traders tend to be more driven by fear, especially during market downturns. Greed usually creeps in when the market is booming or during periods of overconfidence.
How to Manage Fear and Greed
The key to overcoming both of these emotions lies in self-discipline and proper risk management . Here are some tips to help you:
Stick to your plan : Have a clear strategy and trade according to it, not based on emotions.
Use stop-loss orders : They can help you manage risk and prevent fear-driven decisions.
Take profits when targets are hit : Don’t get greedy by holding onto a winning position longer than you should.
Stay realistic : Understand that no trade is perfect—embrace both gains and losses with a level-headed approach.
Conclusion
In trading, it’s natural to experience both fear and greed , but the best traders know how to manage these emotions. Fear and greed can cloud judgment —which is why having a solid trading plan and emotional discipline is key. So, next time you’re making a decision, ask yourself: Is it fear or greed influencing me right now?
What do you think—does fear or greed affect you more? Drop your thoughts in the comments below and let’s talk about how we can all improve as traders!

What is database trading ?**Database trading** refers to the use of databases to store, analyze, and manage large volumes of financial market data to inform trading strategies and decisions. Traders, especially quantitative and algorithmic traders, rely heavily on databases to organize and manipulate market data such as stock prices, volume, economic indicators, and other financial metrics. By using database-driven systems, traders can access vast amounts of data quickly, perform complex analyses, and backtest strategies.
### **How Database Trading Works**:
1. **Data Collection and Storage**:
- In database trading, market data is collected from various sources such as exchanges, financial reports, and APIs. This data includes price histories, order book information, trading volume, technical indicators, news sentiment, and more.
- The data is stored in **databases** (such as relational databases like **MySQL**, **PostgreSQL**, or NoSQL databases like **MongoDB**) where it can be structured for easy retrieval, querying, and analysis.
2. **Data Analysis**:
- Traders use databases to organize and query market data. For example, a trader might query the database to retrieve historical price data for a specific asset, calculate moving averages, or identify patterns.
- Advanced analysis is typically carried out using tools like **SQL** for querying databases, and **Python**, **R**, or **MATLAB** for data manipulation, statistical analysis, and developing trading algorithms.
3. **Backtesting**:
- One of the key uses of databases in trading is **backtesting**. Traders use historical data stored in databases to test their trading strategies. They can simulate how a strategy would have performed in the past by applying it to the data and calculating metrics like returns, risk, and drawdowns.
- **Backtesting engines** often pull data from databases and execute simulated trades based on the historical market conditions stored in the database.
4. **Real-Time Data Processing**:
- Some database systems, especially when integrated with **real-time market data feeds**, allow traders to monitor live market conditions and execute trades automatically based on predefined algorithms.
- Databases play a critical role in storing and processing real-time data, ensuring that algorithms can access up-to-date information and respond to market movements promptly.
5. **Machine Learning and AI**:
- **Machine learning algorithms** can be applied to the data stored in databases to identify trends, correlations, or anomalies that can inform trading decisions.
- Traders can use databases to train models on historical data and then deploy these models in live markets to predict price movements or optimize strategies.
---
### **Why Database Trading is Important**:
1. **Efficient Data Management**:
- Financial markets generate massive amounts of data every second. Databases allow traders to **store, organize, and retrieve** this data efficiently, even when dealing with vast datasets across multiple assets and timeframes.
2. **Scalability**:
- Databases can handle **large datasets** with millions of data points. This is crucial for traders who require a scalable solution to process high-frequency trading data, tick-level data, or large historical datasets.
3. **Speed and Accessibility**:
- Trading systems need to be fast, particularly in high-frequency or algorithmic trading. Databases provide a structured and efficient way to store and query data, ensuring that traders can access the data they need quickly to make real-time trading decisions.
- **Low latency** is especially important when trading in fast-moving markets where decisions must be made in fractions of a second.
4. **Backtesting and Strategy Optimization**:
- The ability to backtest trading strategies with historical data is one of the core advantages of database trading. Traders can assess the viability of their strategies over different market conditions before applying them in live trading.
- This allows for **strategy optimization** by tweaking parameters and testing different variations of a strategy to find the most effective approach.
5. **Data Integrity and Accuracy**:
- Databases provide mechanisms for ensuring the **integrity** and **accuracy** of data, which is crucial for making reliable trading decisions. Traders can perform thorough data validation and cleaning before using the data in their models.
6. **Data-Driven Decision Making**:
- Database trading enables **data-driven decision-making** by providing traders with the ability to analyze and interpret large sets of financial data. This minimizes emotional decision-making and helps traders make rational, systematic choices.
---
### **Types of Data Used in Database Trading**:
1. **Market Data**:
- **Price data**: Historical and real-time price information for various assets (stocks, options, forex, etc.).
- **Volume data**: Data related to the number of shares or contracts traded.
- **Bid/Ask data**: The best available prices for buying (bid) and selling (ask) an asset at a given time.
- **Order book data**: Information about the orders waiting to be executed in the market.
2. **Fundamental Data**:
- **Earnings reports**, **balance sheets**, and **cash flow statements** of companies.
- **Economic indicators** such as GDP growth, inflation, interest rates, and employment numbers.
3. **Technical Indicators**:
- Data generated by calculating moving averages, RSI (Relative Strength Index), MACD (Moving Average Convergence Divergence), Bollinger Bands, and other common indicators used for technical analysis.
4. **Sentiment Data**:
- Data extracted from **news feeds**, **social media**, and **financial reports** to gauge market sentiment.
- Sentiment analysis can help predict how market participants might react to news events or earnings announcements.
5. **Alternative Data**:
- **Geolocation data**, **weather data**, and other unconventional datasets that might provide an edge in predicting market moves.
---
### **How Database Trading Can Be Profitable**:
1. **Automated Trading Strategies**:
- Traders can design **algorithmic trading strategies** that use data stored in the database to execute trades automatically based on certain criteria. By leveraging historical data, these strategies can identify patterns and opportunities that would be hard for human traders to spot.
2. **High-Frequency Trading (HFT)**:
- High-frequency traders rely on **fast, automated decision-making** systems that use real-time data stored in databases. By processing large volumes of data quickly, high-frequency trading algorithms can capture small price movements across numerous assets, leading to profitability through sheer volume of trades.
3. **Risk Management**:
- By leveraging databases for real-time data analysis, traders can implement **dynamic risk management** systems that adjust position sizes, stop losses, and take profits based on market conditions. This helps protect profits and minimize losses.
4. **Predictive Analytics**:
- Machine learning models and predictive analytics can be applied to the data in the database to forecast price movements, asset correlations, and volatility patterns. Traders can use these insights to make informed decisions about entry and exit points.
5. **Improved Strategy Development**:
- With access to vast amounts of data, traders can continuously test, optimize, and improve their strategies. This allows them to stay ahead of market trends and make adjustments to their trading algorithms when necessary.
6. **Diversification**:
- Traders can use databases to analyze a wide range of assets, strategies, and timeframes. This allows them to implement **diversified strategies** and reduce the overall risk of their trading portfolio.
---
### **Challenges of Database Trading**:
1. **Data Quality and Integrity**:
- If the data stored in the database is incomplete, inaccurate, or inconsistent, it can lead to incorrect trading decisions. Ensuring data quality is paramount to successful database trading.
2. **Complexity and Maintenance**:
- Database-driven trading systems require regular maintenance, updates, and tuning. Traders need to manage both the infrastructure (databases, servers, etc.) and the software (trading algorithms, data processing pipelines) to ensure the system runs efficiently.
3. **Computational Power**:
- Analyzing large volumes of data in real-time can require significant computational resources. For high-frequency or machine learning-based strategies, having access to powerful servers or cloud-based infrastructure is crucial.
4. **Latency**:
- In fast-moving markets, even small delays in data processing can affect trading outcomes. High-frequency and algorithmic trading strategies require **low-latency systems** to ensure that orders are executed quickly and accurately.
### **Summary**:
**Database trading** is a powerful approach for managing, analyzing, and executing trades using vast amounts of financial data. It provides traders with a structured and efficient way to store, analyze, and access data, which is essential for developing profitable trading strategies. By using databases, traders can automate their strategies, backtest their models, and analyze large datasets in real time to gain a competitive edge in the market.

what is price action ?**Price action** refers to the movement of an asset’s price over time, depicted through charts. It is the study of historical price data to make trading decisions, without relying on technical indicators or other external tools. In other words, price action traders focus purely on the price itself—its patterns, trends, and movements—believing that all necessary information is contained within the price action.
### Key Concepts in Price Action:
1. **Candlestick Patterns**:
- **Candlestick charts** are commonly used in price action analysis. These charts show the open, high, low, and close prices for a given time period.
- Certain candlestick patterns (like Doji, Engulfing, Hammer, or Shooting Star) are used to identify potential market reversals or continuations.
2. **Support and Resistance**:
- **Support** is the price level at which an asset tends to find buying interest, causing the price to bounce upward.
- **Resistance** is the price level at which an asset tends to encounter selling pressure, causing the price to move lower.
- Price action traders often watch these levels to predict potential reversals or breakouts.
3. **Trends**:
- Price action trading is largely based on understanding market trends (uptrends, downtrends, or sideways movement).
- Traders use **higher highs and higher lows** in an uptrend, and **lower highs and lower lows** in a downtrend to identify and trade with the trend.
- The idea is to "trade with the trend" rather than against it, as trends tend to persist over time.
4. **Price Patterns**:
- Traders look for recurring price patterns such as **triangles**, **flags**, **head and shoulders**, **double tops**, and **double bottoms**. These patterns help in forecasting future price movements.
- For instance, a **double top** pattern (a resistance level followed by a pullback, then another attempt to break the resistance) can signal a potential bearish reversal.
5. **Market Structure**:
- **Higher highs** and **higher lows** indicate an uptrend.
- **Lower highs** and **lower lows** indicate a downtrend.
- A trader’s goal is to identify the structure of the market and trade based on whether it’s in an uptrend, downtrend, or consolidation phase.
6. **Breakouts and Pullbacks**:
- **Breakouts** occur when the price moves beyond a defined support or resistance level, signaling the start of a new trend.
- **Pullbacks** (or retracements) are temporary reversals within the existing trend, and traders often look to enter positions during pullbacks to trade in the direction of the trend.
### How to Use Price Action in Trading:
1. **Identify the Trend**:
- The first step in price action trading is identifying whether the market is trending (up, down, or sideways).
- In an uptrend, you’d typically look for buying opportunities when the price pulls back to a level of support or a previous low.
- In a downtrend, you’d look for selling opportunities at resistance or previous highs.
2. **Look for Key Levels**:
- Identify major **support** and **resistance** levels where price has historically reversed. These levels act as psychological barriers for traders, and price action often tends to react to them.
- **Breakouts** above resistance or below support can indicate the start of a new trend.
3. **Trade Patterns**:
- Watch for **candlestick patterns** (like pin bars, engulfing candles, or dojis) at key levels. These can act as signals for potential trend reversals or continuations.
- For example, a **bullish engulfing candle** at a support level could suggest the start of an uptrend, while a **bearish engulfing** at a resistance level could signal a downtrend.
4. **Wait for Confirmation**:
- Price action traders often wait for price to confirm a setup before entering a trade. For instance, if the price breaks above resistance, they may wait for a pullback to test the new support before entering a long trade.
5. **Risk Management**:
- Price action traders use **stop-loss** orders placed at logical levels based on the price structure (for example, below a recent low in an uptrend).
- **Position sizing** is also crucial. Since price action can often be subjective, it’s important to use proper risk management to avoid large losses.
### Benefits of Price Action Trading:
- **No Indicators Needed**: Price action trading is based purely on price data, making it simple and easy to follow, without relying on technical indicators.
- **Flexibility**: Price action can be used across different time frames, from minute charts to daily or weekly charts.
- **Versatility**: It works across all asset classes (stocks, forex, commodities, crypto, etc.), and it is ideal for both short-term and long-term traders.
- **Clear Signals**: Price action trading gives direct, clear signals based on price movements, which many traders find easier to interpret than complex indicators.
### Drawbacks of Price Action Trading:
- **Subjectivity**: Interpreting price action can sometimes be subjective, as it depends on the trader’s understanding of the price movements and patterns.
- **Requires Experience**: Price action trading involves a lot of nuance and requires experience to recognize and act on subtle price signals effectively.
- **Lack of Confirmation**: Without indicators, traders may sometimes miss the confirmation signals, leading to false or untimely trades.
### Example of Price Action in a Trade:
- A trader sees that a stock has been in a **bullish trend** for a few weeks (price making higher highs and higher lows).
- The stock pulls back to a level of **previous support** (a point where price has reversed before).
- At that support level, the trader notices a **bullish engulfing candlestick pattern** forming.
- The trader enters a **buy** position, placing a stop loss just below the support level, aiming to capture the next upward movement.
### Conclusion:
Price action trading is a straightforward yet powerful method for analyzing and trading markets based on price movements alone. By focusing on patterns, trends, and key price levels, traders can make decisions without relying on complex indicators. However, it does require a keen eye and experience to interpret price movements correctly, and it’s essential to combine it with sound risk management practices.

what is fibonacci retracement ?**Fibonacci Retracement** is a technical analysis tool used by traders to identify potential support and resistance levels in the price movement of a financial asset. It is based on the **Fibonacci sequence**, a series of numbers where each number is the sum of the two preceding ones (e.g., 0, 1, 1, 2, 3, 5, 8, 13, 21, etc.). These numbers are found in nature, and interestingly, they also appear in various aspects of financial markets.
In trading, **Fibonacci retracement levels** are used to predict where prices might reverse or experience a pullback during a trend. These levels are considered potential support or resistance zones, and traders use them to set targets, stop-losses, or entry points.
### How Fibonacci Retracement Works:
1. **Key Fibonacci Levels**:
The key Fibonacci retracement levels are derived from the following ratios, which are based on the Fibonacci sequence:
- **23.6%**
- **38.2%**
- **50%** (This is not a Fibonacci number but is widely used in retracement analysis)
- **61.8%** (This is considered the "golden ratio" and is very significant in Fibonacci analysis)
- **100%** (This level represents the full retracement of a trend)
2. **Drawing Fibonacci Retracement**:
- The tool is used by selecting two points on a price chart: the **swing high** (the highest point) and the **swing low** (the lowest point) of the price movement.
- After identifying these points, Fibonacci levels are plotted between the high and low, creating horizontal lines at the 23.6%, 38.2%, 50%, 61.8%, and 100% levels. These lines represent potential areas where the price could retrace, reverse, or consolidate.
3. **Interpreting Fibonacci Retracement Levels**:
- **Support and Resistance**: The retracement levels act as potential support (in an uptrend) or resistance (in a downtrend) levels. For example:
- In an uptrend, after a price rises and then begins to fall, traders expect the price to retrace or pull back to one of the Fibonacci levels (like 38.2% or 50%) before continuing higher.
- In a downtrend, after a price drops and then begins to rise, traders may watch for the price to retrace to Fibonacci levels (such as 38.2% or 61.8%) before continuing lower.
- **Trend Continuation**: If the price respects one of the Fibonacci levels and reverses in the direction of the trend, it suggests that the trend may continue. If the price breaks through a Fibonacci level, it could signal a potential trend reversal or the continuation of a deeper pullback.
### Example of Fibonacci Retracement in Action:
1. **Uptrend Scenario**:
- Imagine a stock price rises from $100 to $150.
- To analyze potential pullbacks, you would apply the Fibonacci retracement tool between these two points ($100 as the swing low and $150 as the swing high).
- The Fibonacci levels will appear at 23.6%, 38.2%, 50%, and 61.8% of the price move. For example, the 38.2% level might be around $130, and the 61.8% level might be around $120.
- Traders would watch for price action around these levels to see if the price reverses and continues upward (indicating the trend may remain intact).
2. **Downtrend Scenario**:
- If a stock falls from $200 to $150, you could plot Fibonacci retracement levels between $200 and $150.
- Fibonacci levels will be plotted at specific intervals (e.g., 23.6%, 38.2%, 50%, etc.), and traders would look for price action at these levels to identify potential resistance areas.
- If the price retraces to the 50% level (say $175) and then reverses back down, it may indicate the downtrend is still strong.
### Why Fibonacci Retracement Works:
The effectiveness of Fibonacci retracement is attributed to the idea that market psychology often follows patterns or "natural" ratios. Many traders and investors believe that the Fibonacci levels represent natural turning points in the market, and because of this belief, the levels tend to become self-fulfilling prophecies—when many traders place orders around these levels, it increases the likelihood of price reversals at these points.
### Limitations of Fibonacci Retracement:
1. **Not Always Accurate**: Fibonacci levels are not foolproof, and the price may not always reverse at these points. Sometimes the price can break through a level or fail to reach a level altogether.
2. **Requires Confirmation**: It's best to use Fibonacci retracement levels in conjunction with other technical analysis tools, such as candlestick patterns, moving averages, or momentum indicators, for confirmation.
3. **Subjective**: The placement of swing highs and lows can sometimes be subjective, leading to slightly different interpretations of the key levels.
### Using Fibonacci Retracement with Other Tools:
- **Candlestick Patterns**: Traders often look for specific candlestick patterns (like a bullish engulfing or hammer) at Fibonacci levels to confirm potential reversals.
- **Volume**: Higher trading volume at a Fibonacci level may indicate a stronger support or resistance level.
- **Trend Indicators**: Combining Fibonacci retracement with trend indicators (such as moving averages) can help confirm whether the trend is likely to continue after a retracement.
### Conclusion:
**Fibonacci retracement** is a widely used tool in technical analysis that helps traders identify key levels where the price of a financial asset might experience a pullback or reversal. It is based on the mathematical Fibonacci sequence, with key retracement levels at 23.6%, 38.2%, 50%, 61.8%, and 100%. While the tool can be powerful, it is most effective when used in conjunction with other technical indicators and analysis techniques to confirm price movement.

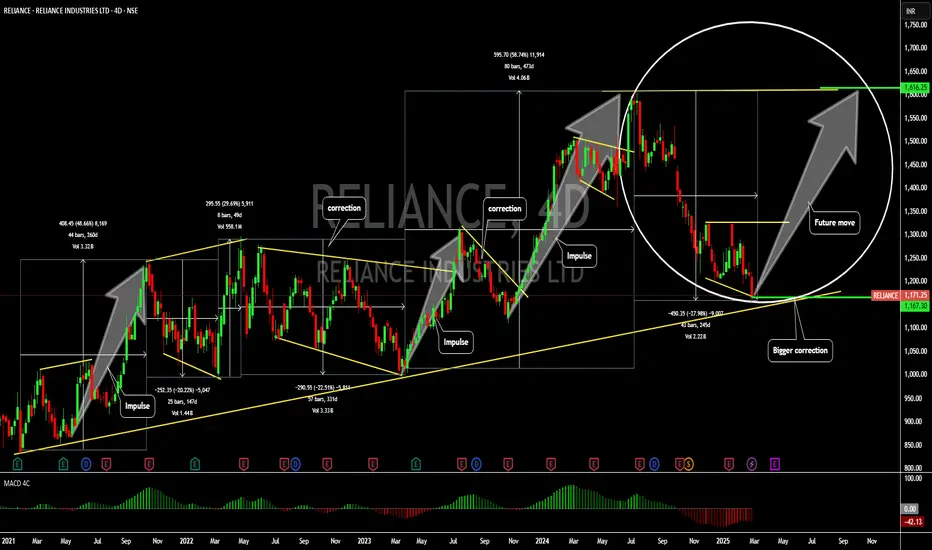
Reliance: Leading the Market Correction & Nearing Strong SupportTopic Statement:
Reliance has undergone a sharp correction in recent months, significantly influencing the broader market downturn, but key technical levels suggest a potential stabilization.
Key points:
1. The stock has corrected to the 38.2% retracement level, receiving strong support.
2. Price is now below the 180-day exponential moving average, indicating oversold conditions.
3. Weekly RSI stands at 34, marking an oversold zone from a long-term perspective.

RelianceDate : 03.03.2025
Relaince
Timeframe : Weekly
Remarks :
1 Broke resistance cum support trendline starting since 2018
2 Broke 200 weekly exponential moving average after 2020 covid crash
3 At present at 38.2% which is make or break for stock
4 fresh short only below 38.2% & keep that as stoploss either side trades long/short
Regards,
Ankur

Reliance : Good Entry Point🚨 #Reliance Share – Opportunity or Caution? 🚨
📉 Why the Dip today ? Reliance shares are under pressure today, largely due to a potential ₹125 Cr fine for not setting up the battery unit.
📊 Key Levels to Watch:
🔻 Support: The stock is trading in a strong monthly demand zone of ₹1110-₹1180, with another support zone below. If it can hold ₹1000 in the coming months, a potential reversal rally could be on the cards.
🔺 Resistance: On the upside, ₹1330-₹1360 is a critical supply zone, aligned with the 20W EMA—a breakout above this could signal a trend reversal.
🚀 What’s the Catalyst?
The highly anticipated Reliance Retail IPO in 2025 could act as a strong fundamental support, reducing the chances of a major sell-off.
📌 Bottom Line: If Reliance defends key support levels, this dip could be an accumulation opportunity for long-term investors!
💬 What’s your take—Buy the dip or wait for confirmation? ⬇️
#learn_at_stoxsense #Learntradingwithsudhir #StockMarketIndia #Optiontrading #learntrading #sebiregisteredra #reliance

Reliance Target After Monthly Negative Closing is 1031**Reliance Industries Limited (RIL)** is India's largest conglomerate, with diversified businesses in **energy, petrochemicals, retail, telecommunications, and digital services**. It is one of the most valuable companies in India and among the world's largest corporations.
---
### **Key Facts About Reliance Industries:**
- **Founded:** 1958 (by Dhirubhai Ambani)
- **Founder:** Dhirubhai Ambani
- **Chairman & MD:** Mukesh Ambani
- **Headquarters:** Mumbai, India
- **Revenue:** Over **₹9 lakh crore ($110+ billion)** (varies yearly)
- **Stock Listing:** **NSE & BSE** (Ticker: **RELIANCE**)
- **Market Cap:** Among India's highest (over $200 billion)
---
### **Major Business Segments:**
#### **1. Energy & Petrochemicals**
- **Reliance O2C (Oil-to-Chemicals):** One of the world’s largest **refining & petrochemical** businesses.
- **Jamnagar Refinery:** World’s largest refining complex.
- **Renewable Energy:** Investments in **green hydrogen, solar, and battery storage** (Reliance New Energy).
#### **2. Reliance Jio (Telecom & Digital Services)**
- **Jio 4G & 5G:** India’s largest telecom provider.
- **Jio Platforms:** Digital services (JioFiber, JioCinema, JioCloud, etc.).
#### **3. Reliance Retail**
- India’s **largest retail company**, covering:
- **Grocery (Reliance Fresh, Smart Bazaar)**
- **Fashion (Trends, Ajio)**
- **Electronics (Reliance Digital, JioMart)**
#### **4. Media & Entertainment**
- Owns **Network18, Viacom18, JioCinema** (OTT platform).
#### **5. New Energy (Green Investments)**
- Investing **$75 billion** in green energy, hydrogen, and solar power.
---
### **Competitors:**
- **Telecom:** Airtel, Vodafone Idea
- **Retail:** Amazon, Flipkart, Tata Group
- **Energy:** Adani Group, ONGC, IOC
Reliance is constantly expanding into new sectors like **EV battery production, AI, and data centers**. Are you looking for stock insights, latest news, or specific business details? 🚀

What is rsi divergence and how to use it in trading ?**RSI Divergence** is a concept in technical analysis where the **Relative Strength Index (RSI)**, an oscillator that measures the strength of a price movement, diverges from the price movement of the underlying asset. This divergence can indicate potential trend reversals, making it an important tool for traders.
### **What is RSI?**
The **RSI** is a momentum oscillator that measures the speed and change of price movements. It ranges from 0 to 100 and is typically used to identify whether an asset is overbought (above 70) or oversold (below 30). It is commonly calculated using a 14-period timeframe, but this can vary.
### **What is Divergence?**
**Divergence** occurs when the price of an asset and an indicator (in this case, the RSI) move in opposite directions. There are two types of divergence:
1. **Bullish Divergence**: When the price makes lower lows, but the RSI makes higher lows.
2. **Bearish Divergence**: When the price makes higher highs, but the RSI makes lower highs.
### **Types of RSI Divergence**
1. **Bullish Divergence**:
- **Occurs when the price forms lower lows**, but the RSI forms higher lows. This suggests that even though the price is declining, the momentum (as measured by RSI) is improving, and the downward trend might be losing strength, potentially signaling a reversal to the upside.
- **Interpretation**: Bullish divergence suggests that the selling pressure is weakening, and there may be a potential reversal to the upside.
**Example**: The price of a stock drops to a new low, but the RSI doesn't reach a new low and starts to climb. This shows that the momentum behind the downtrend is weakening, and the price may soon reverse to the upside.
2. **Bearish Divergence**:
- **Occurs when the price forms higher highs**, but the RSI forms lower highs. This suggests that although the price is rising, the momentum is weakening, which could indicate that the upward trend is losing strength and might soon reverse downward.
- **Interpretation**: Bearish divergence signals that the buying pressure is weakening, and a potential trend reversal to the downside could occur.
**Example**: The price of a stock rises to a new high, but the RSI does not reach a new high and starts to decline. This shows that while the price is rising, the momentum is weakening, and a price drop may be imminent.
### **How to Use RSI Divergence in Trading**
RSI divergence can be used as part of a broader trading strategy to help identify potential trend reversals and entry/exit points. Here's how you can use it effectively:
#### 1. **Identify Divergence**:
- **Bullish Divergence**: Look for a situation where the price is making lower lows, but the RSI is making higher lows.
- **Bearish Divergence**: Look for a situation where the price is making higher highs, but the RSI is making lower highs.
#### 2. **Confirm Divergence with Other Indicators**:
RSI divergence on its own is a powerful tool, but it works even better when combined with other indicators. Some common confirmation tools include:
- **Trendlines**: Draw trendlines on both price and RSI. The breakout of trendlines on both price and RSI can confirm a reversal.
- **Support/Resistance Levels**: If the price reaches a strong support (in the case of bullish divergence) or resistance (in the case of bearish divergence), it adds confidence to the reversal signal.
- **Candlestick Patterns**: Reversal candlestick patterns (like Doji, Engulfing, or Hammer) can provide further confirmation of the divergence signal.
#### 3. **Wait for Confirmation**:
Divergence alone doesn’t guarantee a reversal. It is essential to wait for confirmation before entering a trade. For example:
- After a **bullish divergence**, you might wait for the price to break above a recent resistance level or for an upward candlestick pattern to form.
- After a **bearish divergence**, you might wait for the price to break below a recent support level or for a downward candlestick pattern to form.
#### 4. **Set Entry and Exit Points**:
- **Entry**: Enter a **long position** after a bullish divergence when confirmation (like a breakout or candlestick reversal pattern) occurs. Similarly, enter a **short position** after a bearish divergence when confirmation appears.
- **Stop Loss**: Place stop-loss orders just below the recent swing low for a bullish divergence or above the recent swing high for a bearish divergence.
- **Take Profit**: Set take-profit targets at key support/resistance levels or based on risk-reward ratios (e.g., a 2:1 reward-to-risk ratio).
#### 5. **Timeframe**:
- RSI divergence can be used on different timeframes, but the reliability of the signal often increases with longer timeframes (like daily or weekly charts). On shorter timeframes, the divergence can be more frequent but less reliable, so it’s important to trade carefully.
### **Example of Bullish RSI Divergence in Action**
Let's say you're looking at a stock chart where the price is forming lower lows (e.g., the stock drops from $100 to $90 to $85), but the RSI forms higher lows (e.g., RSI moves from 30 to 35 to 40).
- The price is still falling, but the RSI is showing signs of momentum shifting upward.
- This could signal that the selling pressure is decreasing, and a potential reversal to the upside could occur.
- A trader might enter a **long position** at this point, placing a **stop-loss below the recent low** (around $85) and a **target profit at a resistance level**, such as $95.
### **Example of Bearish RSI Divergence in Action**
Now, imagine you're looking at a stock chart where the price is making higher highs (e.g., the stock rises from $100 to $110 to $115), but the RSI is making lower highs (e.g., RSI moves from 70 to 65 to 60).
- The price is still rising, but the RSI is signaling that momentum is weakening.
- This could suggest that the bullish trend is losing strength, and a reversal to the downside could occur.
- A trader might enter a **short position** at this point, placing a **stop-loss above the recent high** (around $115) and a **target profit at a support level**, such as $105.
### **Limitations of RSI Divergence**:
1. **False Signals**: RSI divergence can sometimes give false signals, particularly in choppy or consolidating markets. The market can remain overbought or oversold for extended periods without reversing.
2. **Lagging Indicator**: Like all technical indicators, the RSI is based on historical data, so it may lag behind price action. Divergence might signal a potential reversal, but the price may not reverse immediately.
3. **Short-Term Divergence**: Short-term divergences may not lead to strong trend reversals and can be part of a larger ongoing trend.
### **Conclusion**
RSI divergence is a powerful tool for spotting potential trend reversals by comparing the price action with momentum. Here's a quick recap:
- **Bullish Divergence** occurs when the price makes lower lows while the RSI makes higher lows, signaling weakening downward momentum and a potential reversal to the upside.
- **Bearish Divergence** occurs when the price makes higher highs while the RSI makes lower highs, signaling weakening upward momentum and a potential reversal to the downside.
By combining RSI divergence with other technical analysis tools and waiting for confirmation signals, traders can improve the reliability of their trading decisions and manage risk more effectively.

reliance support and resistant linethis stock is trading an important crucial trend line (1290 - 1300) which acts as resistant previously and at present it is acting as good resistant.
if this trendline breaks upper side bullish will continue or if it breaks downside bearish may continue.
I don't recommend taking trade based on this idea.
consult your SEBI registered adviser to Know the market risk before trade.
in.tradingview.com/pricing/?share_your_love=johnbritto2088

Reliance start buying for long term SL 1140 Target 1380-1390 ,How to take trades using Harmonic pattern projection Trade setup is explained below :-
Entry : 1st D point : 0% is recent top or bottom.
Trailing SL: 20.2% is work as trailing SL of buy or sell trade if hit then we have to book profit
.If price goes below 20.2% then early or risky traders can reversal trade ,
Targets :
Target T1 : 28.3%
Target T1 : 37.8 %
Target T3 : 48.1%
T3: 60.2% to 66.9 % is our 3rd Target since this is reversal zone so must book profit if break then take fresh trade again
Next Targets are 77.5 % , 88.1 % 100% , 113.5 % , 127.3% , 141.2% and 160.2 , 177.5. final Target 200%
160.2 to 177.5% if profit booking area so book full profit and wait for reversal.
How to take reversal trade :
If price going upside/ downside then then buy or sell levels appear on Chart ( Automatically show when price reach any reversal zone of harmonic projection pattern based .
After showing reversal levels wait for confirmation until 20.2 % or 28.3 % level not break if break then exit from current buy / sell trade and take fresh reverse trade buy/ sell .
Trailing SL:
After reach 1st Target trail SL to just above or below cost ( for example we are holding sell trade from 100 1st Target 110 hit then move trailing sl to 104-105 and move SL as price move upside or Downside)
Re- Entry :
For Re-entry in any pull back Point D ( 10.1% ) is used for re-entry then SL recent high or low Point D ( 0% ) .
Target is same as early 20.2% , 28.3 , 37.8 and so on
Blue Line is 1st support/ Resistance
Green line is 2nd support/ resistance
Red line is 3rd Support/ resistance

Bullish reversal in #RelianceThere is a formation of Bullish Head and Shoulders pattern on the daily chart of Reliance. The left shoulder and the head are already formed. The right shoulder is also half complete. There are good chances that the shoulder will complete.
The neckline is at 1320 which is around 100 Rs far from CMP of 1225.
#reliance #bullish

Reliance industries ltdReliance Industries Limited (RIL) is a diversified conglomerate headquartered in Mumbai, India, with operations spanning petrochemicals, refining, oil and gas exploration, retail, and telecommunications. Here's a comprehensive analysis of RIL's stock performance and financials:
**Stock Performance:**
- **Current Price:** As of February 14, 2025, RIL's share price closed at ₹1,216.95, reflecting a 0.06% increase from the previous day.
- **52-Week Range:** The stock has traded between ₹1,608.95 and ₹1,215.70 over the past year, indicating significant volatility.
- **Market Capitalization:** RIL has a market capitalization of approximately ₹8.5 trillion, making it one of India's largest companies.
**Financial Highlights:**
- **Revenue:** In the fiscal year ending March 2024, RIL reported total revenue of ₹9.17 trillion, a 3.10% increase from the previous year.
- **Net Profit:** The net profit for the same period was ₹69,621 crore, reflecting a 4.38% growth year-over-year.
- **EBIT Margin:** The company achieved an EBIT margin of 14.14% in FY 2024, indicating strong operational efficiency.
**Analyst Insights:**
- **Price Target:** DAM Capital has reiterated a 'Buy' rating on RIL, raising the target price to ₹1,550, suggesting a potential upside of approximately 21.6% from the current market price.
note :-
Reliance Industries Looks very interestingly placed At the bottom of channel. RSI huge divergence. Very small SL can give good returns. CMP 1217
- **Investment Rating:** The consensus among analysts is positive, with an average target price of ₹1,550, indicating a potential upside of 21.6% from the current price.
**Shareholding Pattern:**
- **Promoter Holding:** The promoters, including Mukesh Ambani, hold a significant portion of the company's equity, reflecting strong insider confidence.
- **Institutional Investors:** RIL has a diverse shareholder base, with institutional investors holding a substantial portion of the equity.
**Conclusion:**
Reliance Industries Limited has demonstrated robust financial performance, with consistent revenue and profit growth. The stock is trading at a premium valuation, supported by positive analyst ratings and a strong market position across its diversified business segments. Investors should consider these factors in conjunction with their individual investment goals and risk tolerance.
*Please note that stock market investments carry inherent risks. It's advisable to conduct thorough research or consult with a financial advisor before making investment decisions.*

Reliance is going thru uptrendReliance has bottomed out. Now its time to move uptrend. Target 1320 with SL 1180. Time frame 1month.
