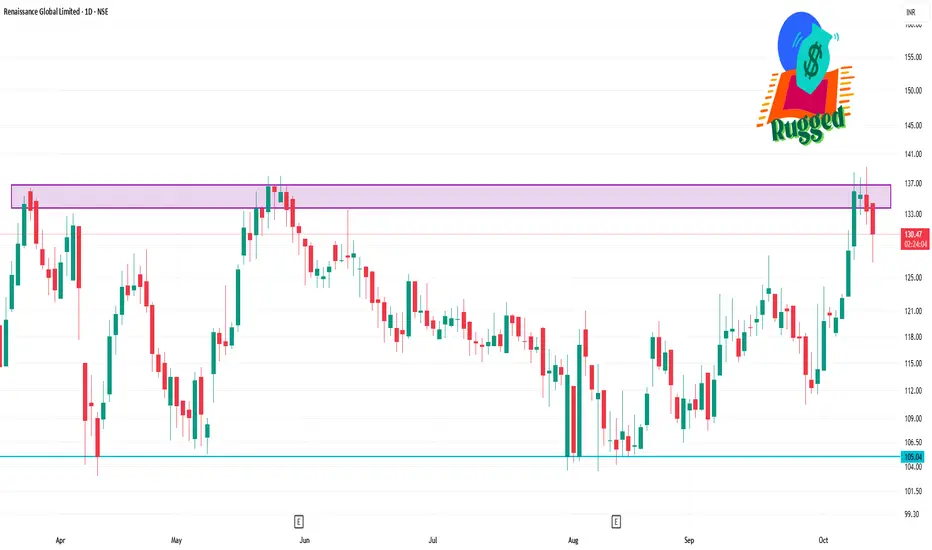
RGL 1 Day Time Frame📊 Intraday Price Movement
Opening Price: ₹135.00
Day's Range: ₹131.60 – ₹139.21
Previous Close: ₹135.46
Volume Traded: Approximately 711,000 shares
Market Cap: ₹1,453.32 crore
🔧 Technical Indicators
Relative Strength Index (RSI): 72.25, indicating potential overbought conditions
Moving Average Convergence Divergence (MACD): 0.82, suggesting a bullish trend.
Support Levels: ₹130.00 and ₹131.60
Resistance Levels: ₹135.46 and ₹139.21
📈 52-Week Range
High: ₹207.40
Low: ₹103.01
Renaissance Global Limited
No trades
What traders are saying
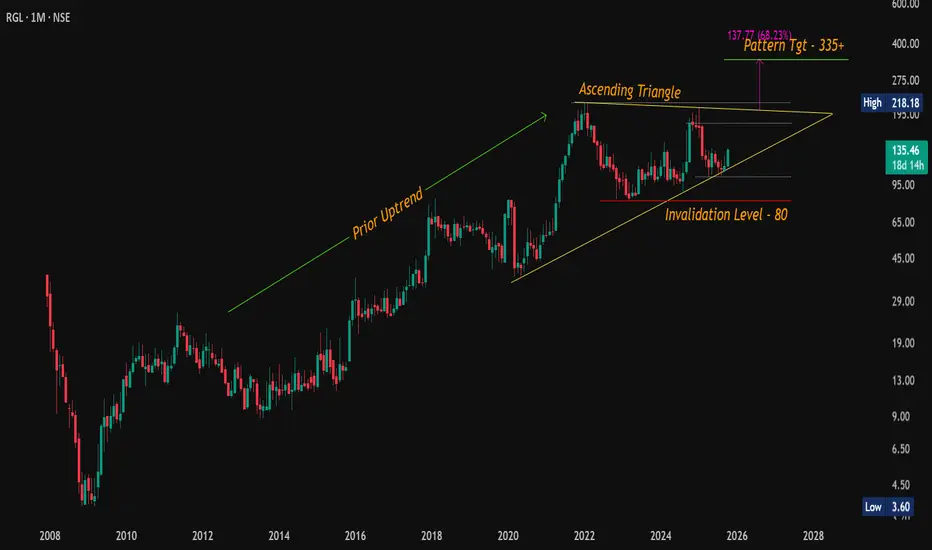
#RGL – Ascending Triangle Breakout Loading?CMP: 135.50
Setting up for a potential bullish breakout with a classic Ascending Triangle pattern on the monthly chart , following a strong prior uptrend.
🔹 Overhead Resistances: 146 / 177 / 207
🔹 Breakout Confirmation Level: 218
🔹 Support Zone: 103 – 99
🔹 Pattern Target: 335+
🔸 ~68% upside from breakout level
🔸 ~150% upside from CMP (135)
📉 Pattern Invalidation Level: 80 MCB
📈 A sustained breakout above 218 (monthly close) may open the gates for a strong move towards 335+. Patience is key on monthly patterns, but reward could be worth the wait.
#RGL | #RenaissanceGlobal | #AscendingTriangle | #ChartPatterns | #LongTerm
📌 Disclaimer: This analysis is shared for educational purposes only. It is not a buy/sell recommendation. Please do your own research before making any trading decisions.
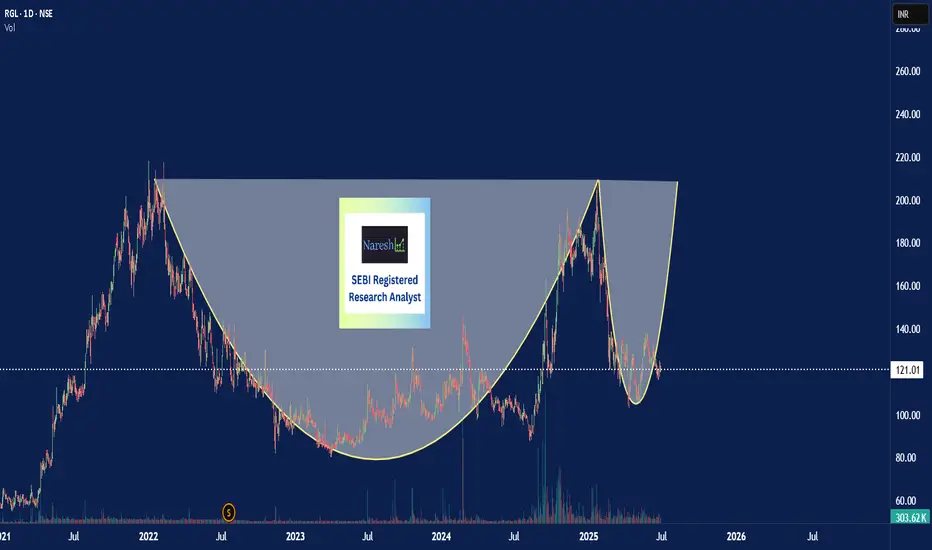
Cup Done - Handle in Making # RGLRGL
Renaissance Global Ltd
LTP 120.20
Add on dips till 105
SL CLB 95
Targets Upto 190
📌 Stick to levels. Follow discipline. Let the trade work for you.
📌Please Follow TSL (Trailing Stop Loss)
To help maximize your profits and protect gains as the trade progresses.
Let’s stay hopeful that the move continues as per our expectations! 📈
💡 Liked the idea?
Then don’t forget to Boost 🚀 it!
For more insights & trade ideas,
📲 Visit my profile and hit Follow
Warm regards,
Naresh G
SEBI Registered Research Analyst
RGL Global Ltd. Base Breakout!Analysis of Renaissance Global Ltd (RGL)
Technical Overview:
Base Breakout: Immediate resistance at ₹217.62.
Safe Traders: Wait for the ₹217–₹218 level to break with high volume and a strong Wide Range Candle (WRC) for confirmation.
Entry Level: ₹205.77.
Stop Loss (SL): ₹179.27 (12.88%).
Target 1 (T1): ₹251.60 (+22.28%).
Target 2 (T2): ₹297.10 (+44.45%).
Risk-Reward (R:R): 1:1.73 for T1, 1:3.45 for T2.
Technical Highlights:
Volume: Significant increase, indicating accumulation.
RSI: Gaining strength, showing bullish momentum.
Fundamental Overview:
Market Cap: ₹1939 crore.
P/E Ratio: 26.2 (compare with sector P/E for evaluation).
ROCE: 8.25%, reflecting mediocre efficiency.
Fundamentals aren't highly attractive but technicals suggest good potential.
Key Risks:
Sector Comparison: Evaluate P/E and ROCE against industry peers.
Breakout Strength: Ensure price sustains above ₹217–₹218 with robust volume for safer entry.
Disclaimer:
This analysis is for educational purposes only and not financial advice. Trade based on your risk tolerance.

RGL resistance breakout stock has broken thier resistance good to hold for long
only for educational purpose
not for sugesstions

Turning Bullish: RENAISSANCE GLOBALRENAISSANCEGLOBAL has turned bullish.
Good volume buildup is seen in monthly chart.
Resistance levels: 132, 145, 163
Support levels; 120, 110, 94

RGL Cup and Handle Formation Signals Potential 16% UpsideIn the daily time frame chart of Renaissance Global Ltd (RGL), I have identified a compelling Cup and Handle pattern, which is a bullish continuation formation that suggests potential for upward movement in the stock price. Currently, the stock appears to be in the process of forming the handle, a critical phase where consolidation occurs after the initial cup formation.
The handle formation is being supported by the Fibonacci retracement level of 61.8%, which is often viewed as a significant support area following a price correction from a recent HH. This retracement suggests a healthy pullback, providing a solid base for buyers to re-enter and push the stock higher.
Over the past few weeks Volume growth during the formation of the handle is a bullish sign, indicating increased interest and participation from traders and investors. MACD on weekly time frame has crossed above the zero line, with the histogram currently reading above 3. This bullish crossover indicates a strengthening momentum, suggesting that the stock may continue its upwards trajectory. Additionally, the RSI for the weekly chart is positioned around 66, inching toward the overbought territory, signaling robust buying pressure, but caution is warranted as the stock approaches these levels.
Currently, the stock appears to be in an accumulation zone, with the price fluctuating between 120 and 125. This range may serve as an opportunity for investors to build positions as the underlying fundamentals, supported by technical indicators, with a solid support level is established at 104. The next resistance target is identified at 146 which could result in approximately a 16% return from the current accumulation zone.
Disclaimer: The information provided in this stock analysis is for informational and educational purposes only and should not be construed as financial advice. Always seek the advice of a qualified financial advisor or conduct your own research before making any investment decisions.

RGL🔶𝗜 𝘀𝗰𝗮𝗻𝗻𝗲𝗱 𝘁𝗵𝗿𝗼𝘂𝗴𝗵 𝗵𝘂𝗻𝗱𝗿𝗲𝗱𝘀 𝗼𝗳 𝘀𝘁𝗼𝗰𝗸𝘀 𝘀𝗼 𝘁𝗵𝗮𝘁 𝘆𝗼𝘂 𝗱𝗼𝗻'𝘁 𝗵𝗮𝘃𝗲 𝘁𝗼🔸
Here are My Top 8 Breakout Picks!
7. RGL
-14% improvement in operating margins
-book value Rs 120
-breakout soon candidate
cons
-higher inventory than peers which is now lower in valuations after the duty cut in the budget

RGL gave strong buy signal on daily & weekly timeframe RGL gave strong buy signal on daily and weekly timeframe. Any corrections will be opportunity to add to portfolio.

Long-Term Investment Strategy - Ride the Bullish Trend!📈 Strategic Long-Term Investment Approach for Maximizing Gains
Looking for a disciplined and effective method to grow your investments over the long term? This strategy offers a structured way to capitalize on bullish trends while managing risk:
1️⃣ Entry Point: Invest when the price crosses above the supertrend level, indicating a confirmed bullish trend.
2️⃣ Target 1 - Secure Early Gains: Sell 40% of your holdings when the stock appreciates by 40%. This allows you to lock in profits and de-risk your position early.
3️⃣ Target 2 - Maximize Returns: Sell an additional 30% of your total holdings after the stock rises another 40% from the first target. At this point, your initial capital is fully recovered, and you’re already in profit territory.
4️⃣ Final Step - Free Equity: Retain the remaining 30% of your shares, now completely free of cost. These shares can be held indefinitely, providing you with exposure to potential long-term growth without any capital risk.
This approach allows you to systematically take profits while maintaining a stake in the company's future growth, all with the security of knowing your investment is back, plus a profit.
Disclaimer:
We are not SEBI-registered advisors. The information provided is for educational purposes only and should not be considered financial or investment advice. Stock market investments involve risk. Please consult a SEBI-registered advisor before making any investment decisions. We are not liable for any losses resulting from the use of this information.

Great volumes!Volumes show good accumulation.
Entry at CMP
SL at 91
Target at 210
Sharing this for educational purpose!

RGL : Breakout Stock (1-3 Months)#RGL #breakout #patterntrading #roundingbottom #trendingstock
RGL : Breakout Stock (Weekly chart) - (1-3 months Trade)
>> Rounding Bottom Formation
>> Trending / Momentum Stock
>> Big Volume Breakout
>> Low Risk High Reward Trade
Swing Traders can lock Profit at 10% & Keep Trailing.
If u Like the Analysis, Consider giving it a like or Boost or leave a comment.
Disc : This are my person Views, Do your Own Analysis and research or Consult your Financial Advisor or Consult a SEBI Registered Advisor before taking position in it.

RGL: Trading near breakout rangeRGL is looking good on weekly time frame. Stock is trading near breakout range. Keep on radar.

RGL: Trading near breakout level on weekly time frameRGL is looking good on weekly time frame. Stock is attempting breakout from 2-3 weeks . Keep on radar. Festival season can lead to bring momentum soon.

RGL: Looking good on weekly time frameRGL is looking good on weekly time frame. Stock is attempting breakout from couple of week. Keep on radar. Inspite of weak market conditions, stock is showing strength and getting recover from correction.

RGL : Trading near breakout level on WTFRGL is looking good on weekly time frame. Stock is attempting breakout. Keep on radar.

RGL price action analysis Stock has given BO on daily and weekly chart with good volume build up, and also heading for forming Cup and handle pattern, follow chart for proper support and resistance levels.

3 Amazing swing trading ideas for 19 October I daily make educational content videos for swing / positional trading

RGL - Breakout after 150+ daysDetailed View about this Breakout:
No.of Resistance: 2
No.of Support: 3
Consolidation days : 150+ days
I Post educational chart for 3 Swing / Potential Stocks Everyday.
Check Related Ideas section for more Swing Stock analysis.

Watchlist-RGL--Bullish flag pattern
--taken goog support and stock is is in uptrend
--buy when candle break the flag pattern and closed above the trend line upside
--Target 145+ within 4-5months (on your own risk reward ration)
Disclaimer:
- The view expressed here is my personal view
- Any decision you take, you need to take responsibility for the same
- It's your hard earned money. Treat it wisely
- Trade / Invest keeping in mind your trading style, goals and objectives, time horizon & risk tolerance
-- Do your own analysis and consult your financial adviser if need be

Multi fold return set up1. Breakout with 8 months consolidation
2.Trend is bullish in all time frame
3. Multiple confirmation on charts and probable bigger returns set up can be seen

How to search for stocks at 200EMA?One of Trading Views' strongest feature is its screener. Probably the best some of us have gotten used to so far. This is a small tutorial /writeup to help you search for stocks probably sitting at support.
Remember, for certain stocks their area of value is 20EMA, while for some it’s 50EMA and for others it could also be 100EMA, so on and so forth. Basically, once you understand how this works, you can choose to tweak the values presented here to your liking.
Having said this, let's figure out how to search for stocks that are on or have fallen to 200EMA. You can always choose a different value according to your search needs. For this tutorial we will stick to finding stocks at 200EMA.
But before we move forward, let's get a basic understanding of what we are trying achieve. In a day/week/month/quarter a stock will always make a high and a low and the price will always fluctuate between this range or it will make a new day’s high or a new day’s low.
The example below is a visual representation of a very basic candle or price movement within a range. I am sure you all know this but I am trying to make this as simple as possible for everyone to follow. So, all you need to take away from this is, there is a high, there is a low, and there is a body that represents opening price and closing price. Some candles will not have a body but I do not want to dive into the details of candlesticks. Google is your best friend to know more on candlesticks!
What we are trying to do here is to restrict the search query from giving us stocks/scripts that are above 100EMA. Yes, you got it right. We are going to restrict the highs from going above the 100EMA and restrict the lows from going below the 200EMA.
Without wasting more time, here is how you do it.
Head over to Screeners and select ‘Stock Screener’
You should be on Trading Views default ‘Stock Screener’ page with a default set of filters. This screen displays stocks based on the filter you have selected. The Trading View screener always defaults back to the last used filter.
Now, let’s tweak TVs search filter. Click on ‘Filters’. This will open up the Screener settings menu.
In the search bar, type ‘High’. ‘High’ represents the highest value the stock reached in a single day. You should see 2 drop down options. For the first, choose ‘Below’ and for the second, choose ‘Exponential Moving Average (100)’
Go back to the search box and type ‘Low’. ‘Low' represents the lowest value the stock reached in a single day. You should again see 2 drop down options. For the first, choose, ‘Above’ and for the second, choose ‘Exponential Moving Average (200)’
Now, this part is important to get consistent search results. What happens with only the above search query is that you get a very convoluted or mixed search result where the EMAs get intertwined. Adding this section helps prevent the EMAs and overall search result from being all over the place.
Head back to the search box and type ‘Exponential’. What you need to edit is 100EMA. From the first drop-down choose ‘Above’ and for the second choose ‘Low’ or you could also choose ‘Exponential Moving Average 200’. This setting remains mostly constant even if you edit the above search parameters.
Close your ‘Filters’ settings menu and click the drop-down menu beside 'Filters' to ‘Save’ your newly created filter. Select ‘Save Screens As…’, give your new search filter a name and you should be done.
Viola! Your new search filter is ready to be used.
However, if your search result is huge (it should be), you can tweak it a little further to reduce the total number stocks returned by the filter. Here is what you need to do.
Head back to the filter menu and type 'Last'. ‘Last’ represents the closing price of the stock. From the first drop down option choose 'Between' and enter your desired range in the 2 boxes. Here you are defining the price range of stocks that are within the value of 100 and 800. So, TV will only display stocks that fall in between this range.
In addition to all this, you can limit your search to only one Exchange. Which is either the 'BSE' or the 'NSE' exchange instead of both.
To do this, type 'Exchange' in the filter search menu and choose either one.
Psst: Don't forget to save your filter each time you edit else TV will not save your edits!
Hope you found this helpful and I sincerely hope you find a ton of good stocks to invest in!
Happy Trading!

RGL Ascending Triangle FormationDetailed analysis given on the chart
RGL Ascending Triangle Formation
NSE:RGL
