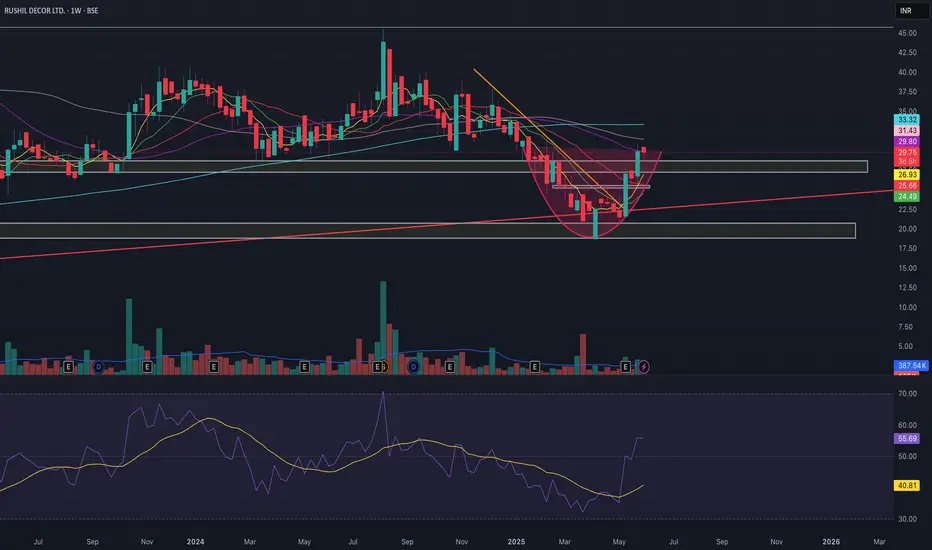
RUSHIL DECOR easily set to give an upside till 40CUP formation completed in W.
Taken support on MA.
RSI showing strength & also expect some consolidation as the price is at the resistance zone now which is 30.
CMP:30, target :33+ SL: 26
Rushil Decor Ltd.
No trades
What traders are saying
RUSHIL DECOR LTDIt is a 994 cr company which manufactures Plywood and MDF board with a P/E of 23 as compared to industry P/E of 35.
On chart it is above 200 DMA. Almost a year downtrend has been broken and last week volume is on higher side. It has resistance zone 390 to 405. above that it can go higher, first target can consider above 500 which is again a resistance zone as marked in chart.
SL can be consider when long term uptrend is broken(weekly closing) as marked on chart.
This is not a Buy/ sell recommendation.

RUSHIL DECOR - Swing Trade Analysis - 3rd August #stocksRUSHIL DECOR (1W TF) - Swing Trade Analysis given on 3rd August, 2024
Pattern: SYMMETRICAL TRIANGLE BREAKOUT
- Weekly Resistance Trendline Breakout & Retest - Done ✓
- Strong Pullback candle after retest - Done ✓
- Demand Zone Retest & Consolidation (for a small SL and a better RR) - In Progress
Please Note:
- There is a stock split expected on the 9th of August
- Only working on the momentum for this trade
* Disclaimer

Rushil trade Trade according to my view
Triangle contraction pattern formation
Weekly time frame
Expected target upto 480
In 4 to 5 months

RUSHIL DECOR BULLISH BREAKOUTIts a bullish wedge breakout. breakout is happened after a long consolidation with huge volume

RUSHIL DECOR - Price analysis & Observation1. Consolidating as of now.
2. Above 450 I will be interested.
3. Moves can slow and choppy. (Not a momentum trade)
4. Results are weak.
5. Decent volume spikes means this can be a good accumulation zone.
- Stay tuned for further insights, updates and trade safely!
- If you liked the analysis, don't forget to leave a comment and boost the post. Happy trading!
Disclaimer: This is NOT a buy/sell recommendation. This post is meant for learning purposes only. Please, do your due diligence before investing.
Thanks & Regards,
Anubrata Ray

Rushil-SG Bhago volume constrictionRushil-SG Bhago volume constriction
1) Volume increasnig
2) Price increasing
3) Lets see

RUSHIL DECOR BREAKING OUT AGAIN.If you missed trade in FSL then here is another one. NSE:RUSHIL double bottom breakout awaited on closing basis, price broke out today. Weekly chart looks even stronger, earlier than before. Expecting 20% gains soon.

RUSHIL - Weekly AnalysisIn the Weekly Chart of RUSHIL ,
we can see that, it has respected the Trendline.
Enter on breaking the Candle's high with low as SL.
Possible momentums are shown in chart.

600+ possible by year endSome move has started in this stock after a long base consolidation around 270 levels.

BREAKOUT, RUSHIL DECOR, 50% RETURNS!!!BUY - RUSHIL DECOR LTD
CMP - Rs. 387
Target - 1: Rs. 447
Target - 2: Rs. 584
.
Timeframe - 4 - 10 months
.
Technicals - Trendline Breakout
.
This is just a view by an expert analyst, please invest at your own risk.
.
Follow me for more!

Rushil Decor Looking good
Good day,
Hello Traders,
De Nora is looking good after forming a big rounding bottom pattern on Daily Time frame as of now.
May head towards the target of 2000+ in the coming days
Keeping 1688 as strict stoploss one can go long for a Risk Reward 1: 3
Time Frame: Daily.
Chart Self Explanatory.
Disclaimer: I am not SEBI registered analyst; this is for educational purposes.
Please trade as per your risk and do consult with your financial advisor before taking any
trading decisions.
If you really like the analysis, please do comments, LIKE and Follow me.

Double Bottom & Head and Shoulders Bottom PatternRushil Decor Ltd.
Daily Chart showing Double Bottom & Head and Shoulders Bottom Pattern Formation
Double Bottom Pattern
The price seems to have reached a bottom after failing to break through a support level and ultimately rising higher in a sign of reversal to a new uptrend.
The Double Bottom pattern forms during a downtrend as the price reaches two distinct lows at roughly the same price level.
Head and Shoulders Bottom Pattern
The price seems to have reached the end of a period of "accumulation" at the bottom of a major downtrend; the break up through resistance signals a reversal to a new uptrend.
The Head and Shoulders Bottom is created by three successive declines in the price following a significant downtrend.
Note for everyone who came across this reference:
This chart analysis is only for reference purpose.
This is not buying or selling recommendations.
I am not SEBI registered.
Please consult your financial advisor before taking any trade.

Stage 2📌Dabangg Stage 2 Entry
RUSHIL
+ Coming out of a good Base
+ Trading above Key EMAs
+ No entries for now

📈 Exciting Bullish Pattern Alert! 🐂📈 Exciting Bullish Pattern Alert! 🐂
📊 Pattern: Symmetric Triangle
📌 Symbol/Asset: RUSHIL
🔍 Description: Stock is in a consolidation and making pattern. Soon we can see momentum after breakout or breakdown !!
👉 Disclosure: We are not SEBI registered analysts, this is not a buy or sell recommendation. Technical patterns are just one piece of the puzzle. Consider conducting further research, consulting with a financial advisor, and managing your risks appropriately.

Setting up nicely for Stage 2 BO📌Setting up nicely for Stage 2
✅Must add to your watchlist
RUSHIL
+ Big Stage 1 Base (Ready for Reversal)
+ At 200 EMA
+ Volume Dry up


Long Idea - Rushil DecorThis stock has given a strong reversal with high volume. This is supported with a fantastic Q2 results where EPS grew over 340% over Q2 FY22. Trading at a very attractive PE of about 11. Target is 700.

RUSHIL LONGEarlier posted the CnH is playing out beautifully.
On a larger TF, its a rounding bottom bo or even better an IHnS above 635.
The atrgets of this come to 4 digits as marked on the chart.
Quite undervalued and commentary is good from the management.
This stock is a definite buy with a poitional SL of 540 on Wclbs.

RUSHIL near Resistance levelsRUSHIL CMP 581 stock reached at resistance level if sustain above 602 then 670-755 long term 1000++ Possible support at 530

RUSHIL longA perfect example of CnH pattern.
Made a weekly gap on HUGE volumes Which still is not filled.
Staying above 570 will propel it further

Rushil DecorRelative Strength combined with good volumes preceded by a good earnings gap gives it all the right ingredients for a good potential ahead

Confirming Strong BreakoutOpening of today is showing and confirming the strong break out of parallel channel
Also High volume in buying
Strong RSI + Relative Strength
